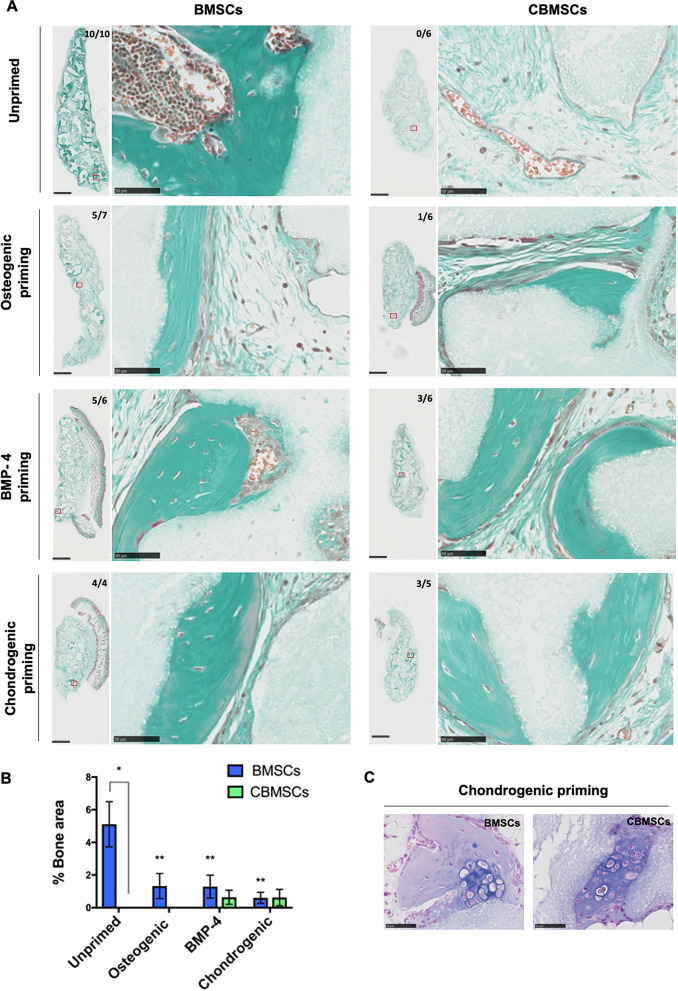
Figure 5.
Ectopic bone formation by implantation of BCP biomaterial in combination with either BMSCs or CBMSCs, w/o priming prior to implantation in nude mice. (A) Masson’s trichrome staining of explanted tissue sections after 8 weeks. Newly formed bone is evidenced in green, while BCP biomaterial is shown in grey. The bone incidence score on each group represents the number of implants with newly formed ectopic bone over the total number of implants in that group. The red box on the whole implant sections represents each magnified image presented. Scale bars represent 1 mm and 50 μm for whole implants and magnified images respectively. (B) Histomorphometry quantification of ectopic bone formed in each group. Data are presented as mean ± SEM of the mean. (C) Alcian blue staining of explants after 8 weeks in subcutis sites. Cartilage was observed in both BMSC and CBMSC groups, but only when cells underwent chondrogenic priming prior to implantation. Statistical analysis was by two-way ANOVA followed by Holm–Sidak’s multiple comparison test. *Significant difference between MSCs of different tissue origin; **statistical difference between unprimed and primed conditions of BMSCs.

