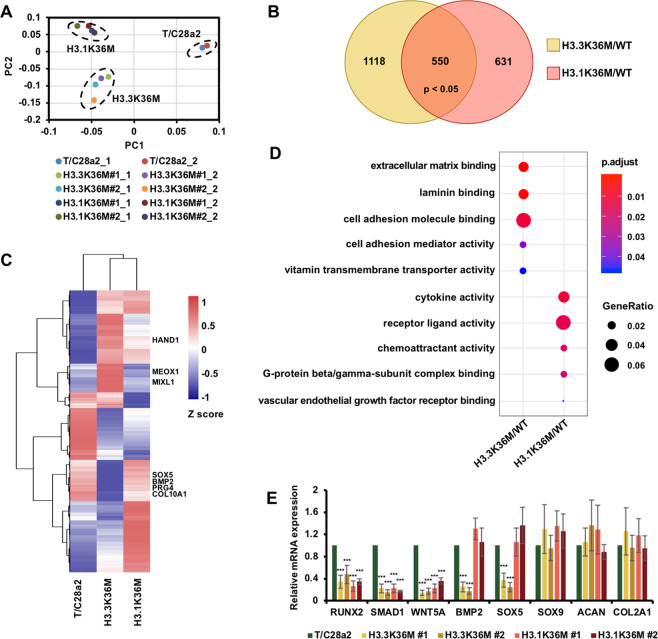
Fig. 2. H3.3K36M and H3.1K36M alter the expression levels of different sets of genes.
A The principal component analysis (PCA) plot of the transcriptomic data from wild-type (WT), H3.3K36M, and H3.1K36M cells. The transcriptomic data from the independent clones of H3.3K36M- and H3.1K36M-mutant cells and two replicates were presented. B Venn diagram illustrating the overlap between the genes altered in the H3.3K36M- and H3.1K36M-mutant cells compared with their levels in WT cells. The RNA-seq data from two independent clones were merged to analyze differentially expressed genes. C Gene expression heatmap for wild-type, H3.3K36M, and H3.1K36M cells. All the changed genes between wild-type and H3K36M-mutant cells were collected for this clustering analysis. To represent the consistently changes of RNA-seq data, we firstly merged two replicates of each cell line and then merged the RNA-seq data of two independent clones of H3.3K36M and H3.1K36M. D The scatterplot shows the gene ontology (GO) analysis of the differentially expressed genes. The colors indicate the p value. The size was scaled according to the fractions of genes in the GO terms. E The expression levels of chondrogenic differentiation-related marker genes were analyzed via RT-PCR. The data are represented by the mean ± SD (N = 3 independent replicates, ***p < 0.001).

