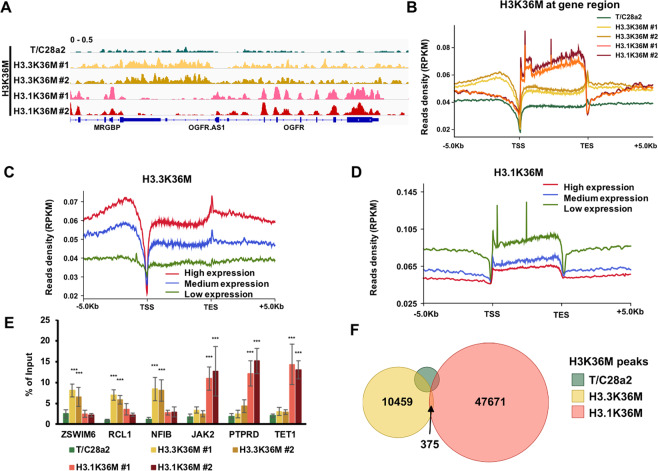
Fig. 5. H3.3K36M is enriched in regions lacking H3.1K36M.
A IGV tracks showing the chromatin distributions of H3K36M in wild-type (WT), H3.3K36M-, and H3.1K36M-mutant cell lines. B The distribution profiles of normalized H3K36M read density from 5 kb upstream of the TSS to 5 kb downstream of the TES. PRKM reads per kilobase million. C, D Normalized read density of H3K36M from 5 kb upstream of the TSS to 5 kb downstream of the TES in grouped genes with high, medium, and low expression levels. The average read densities of the H3K36M ChIP-seq in H3.3K36M- (C) and H3.1K36M- (D) mutant cells were calculated. The genes were separated into high expression, medium expression, and low expression groups based on their expression levels. E H3K36M enrichment analyzed via ChIP-qPCR. The data are represented by the mean ± SD (N = 3 independent replicates, ***p < 0.001). F Venn diagram illustrating the overlap of the H3K36M peaks in H3.3K36M- and H3.1K36M-mutant cells. The H3K36M peaks in independent H3.3K36M- and H3.1K36M-mutant clones were combined.

