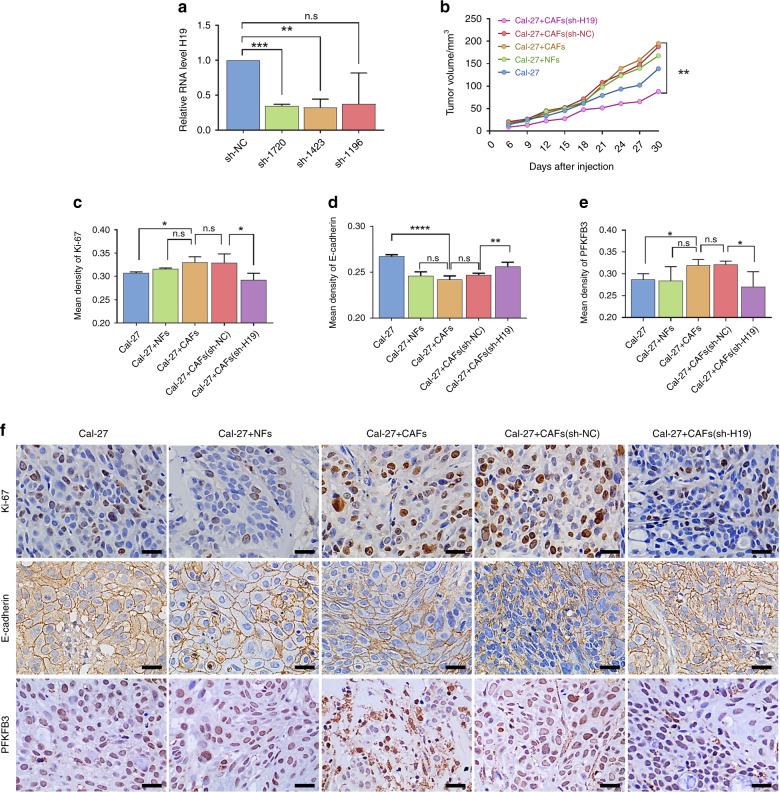
Fig. 5.
Knockdown of lncRNA H19 suppressed tumor growth in vivo. a RT-PCR was performed to estimate the relative lncRNA H19 levels between CAFs infected with sh-H19 (sh-1720, sh-1423, and sh-1196) and the negative control (sh-NC). In addition, the sh-1720 cells were renamed sh-H19 (n = 3). b Tumors were measured with calipers, and volumes were calculated every week; the line chart shows the differences (n = 4). c–e The mean density (MD) of Ki-67, E-cadherin, LDH and PFKFB3 is expressed as the mean ± SD. f Representative immunohistochemistry staining of Ki-67, E-cadherin, and PFKFB3 in tumors from the nude mouse transplanted model. Scale bars: 20 μm. n = 4; error bars, mean ± SD; n.s., not significant, *P < 0.5, **P < 0.01, ***P < 0.001, ****P < 0.000 1; by t-test

