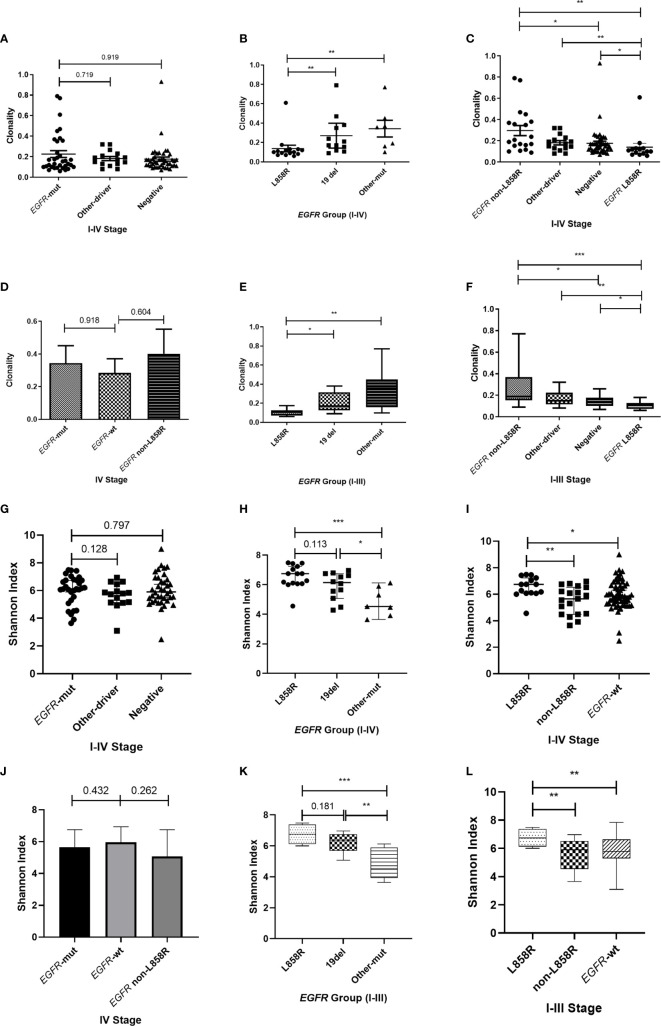
Figure 3.
Correlation between T-cell receptor repertoire and EGFR mutations. (A, G) Comparison of clonality/Shannon index among the three groups. (B, H) Differences in clonality/Shannon index within EGFR subtypes. (C, I) Comparison of clonality/Shannon index between EGFR subtype and other groups. (D, J) Differences in clonality/Shannon index among three groups of patients with stage IV disease. (E, K) Differences in clonality/Shannon index within EGFR subtype of patients with stage I–III disease. (F, L) Comparison of clonality/Shannon index between EGFR subtype and other groups of patients with stage I–III disease. Statistical analyses were performed using the Mann-Whitney test. *p < 0.05, **p < 0.01, ***p < 0.001. wt, wild type.

