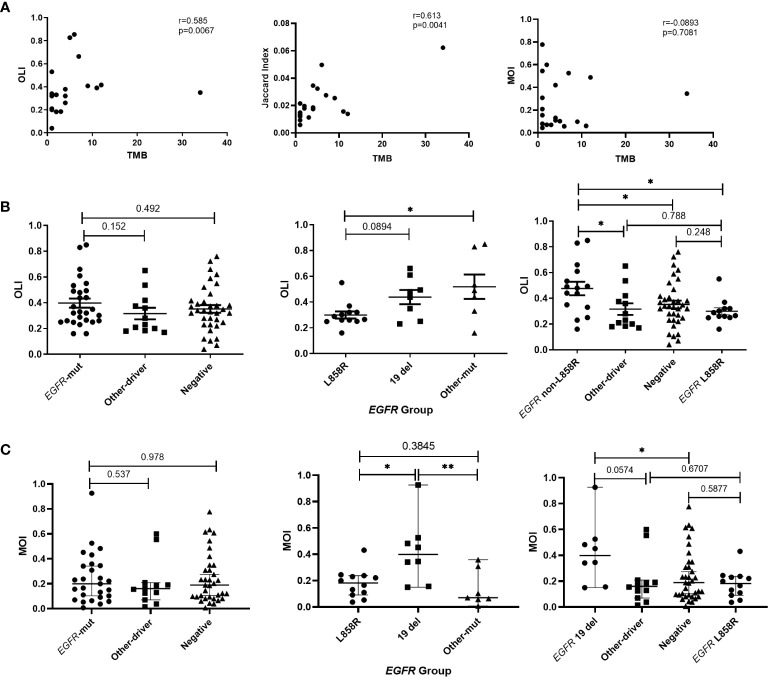
Figure 5.
Relationships of T-cell receptor (TCR) similarity metrics with molecular characteristics. (A) Correlation between TCR similarity metrics and tumor mutation burden (TMB) of tissues. (B) Differences in Overlap Index (OLI) among EGFR, other-driver, and negative groups, and differences in OLI among EGFR subtypes. (C) Differences in Morisita Index (MOI) among EGFR, other-driver, and negative groups, and differences in MOI among EGFR subtypes. Statistical analyses were performed using the Mann-Whitney test and Spearman’s rank test. *p < 0.05, **p < 0.01. Mut, mutation.

