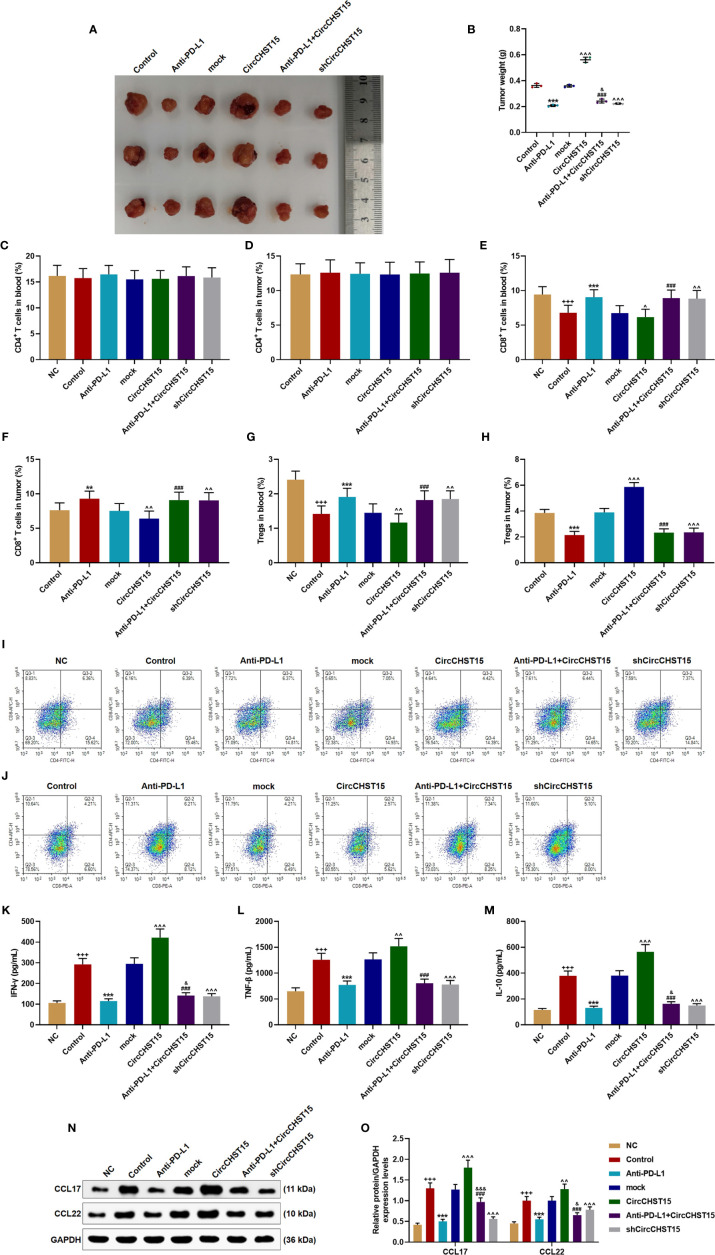
Figure 7.
CircCHST15 regulated the tumor growth, the T cell subtype, and the secretion of related-factors in mouse tumor tissues. (A) The solid tumors were shown. (B) The weight of a solid tumor was calculated. (C, D) The level of CD4+ T cells in the blood (C) and tumor supernatant (D) of mice was quantified by the flow cytometer. (E, F) The level of CD8+ T cells in the blood (E) and tumor supernatant (F) of mice was quantified by the flow cytometer. (G, H) The level of Tregs in the blood (G) and tumor supernatant (H) of mice was calculated based on the formula: Tregs+ (%) = [(CD3+ + CD4+ + CD25+ + total cell number)/CD3+ + total cells number] × 100%. (I, J) The proportion of immune cell subsets in peripheral blood and tumor was measured by flow cytometry. (K–M) The levels of IFN-γ (K), TNF-β (L), and IL-10 (M) in the blood of mice were detected by ELISA. (N, O) The expressions of CCL17 and CCL22 in the mouse tumor tissues were detected by Western blot, GAPDH was used as an internal control. (+++ P < 0.001, vs. NC; **P < 0.01, ***P < 0.001, vs. Control; ^ P < 0.05, ^^ P < 0.01, ^^^ P < 0.001, vs. mock; ### P < 0.001, vs. CircCHST15; & P < 0.05, &&& P < 0.001, vs. Anti-PD-L1).

