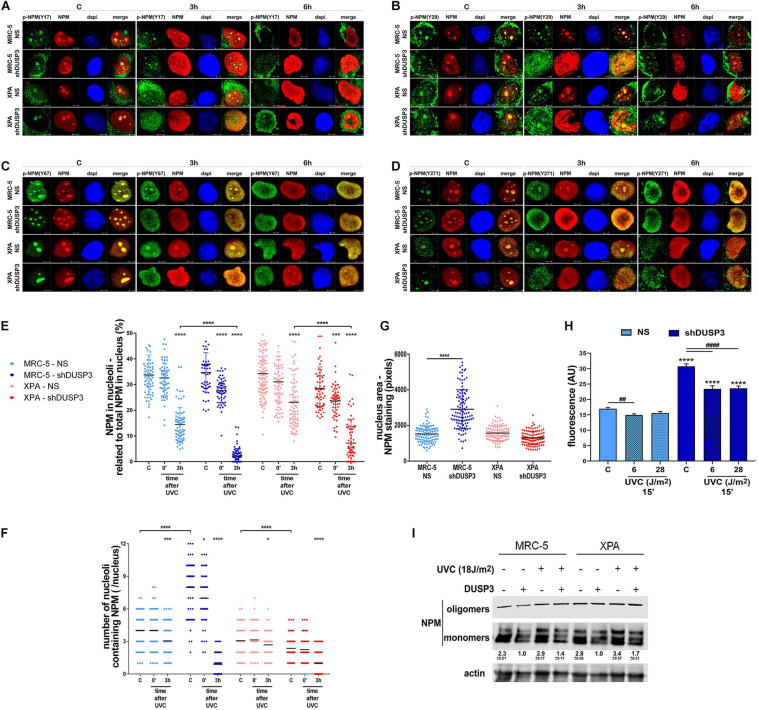
FIGURE 3.
The NPM translocation and oligomerization, the global RNA transcription, and the nuclear and nucleolar morphology are all affected by DUSP3 knockdown. (A–D) To verify the location of Tyr-phosphorylated NPM after 18 J/m2 UVC exposure, confocal microscopy was performed in MRC5 and XPA cell lines (NS or shDUSP3) and compared with the staining of total NPM. The phosphorylation of Y29, Y67, and Y271 residues of NPM is observed in the nucleolus at basal conditions colocalizing with total NPM and remain phosphorylated after its translocation to the nucleoplasm (the complete kinetics is in the Supplementary Figure 3). In shDUSP3 cells p- Y29-, p- Y67-, and p-Y271-NPM reached the nucleoplasm 3 h after UVC, while in non-silencing (NS) cells they remain in nucleolus. Representative images are only qualitative and white scale bars are 5 μM length at 63 × magnification. (E) The NPM translocation was measured by ImageJ software as percentage of NPM present in nucleolus of at least 100 individual nuclei. shDUSP3 cells show an early nucleolus-nucleoplasm translocation of NPM. The same collected confocal images were used to count the number of nucleoli per nucleus (F) and the nuclear area (G). In MRC-5 cells, the DUSP3 knockdown implied in greater number of nucleoli and larger nuclei compared to XPA cells. (H) General assay for RNA transcription using ethynyl uridine (EU) shows that MRC-5 shDUSP3 cells present greater transcriptional activity, size, and number of nucleoli per nucleus (Supplementary Figure 4). (I) Immunoblotting for NPM performed in gradient semi-native gels of total lysates from MRC-5 and XPA cells submitted or not to UV radiation. Representative blottings from three independent assays show greater levels of monomeric NPM under DUSP3 knockdown and after UVC exposure. Note: “–” indicates DUSP3 knockdown (shDUSP3 cells) and “+” indicates DUSP3 presence (NS cells). Anova: ****: p < 0.0001.

