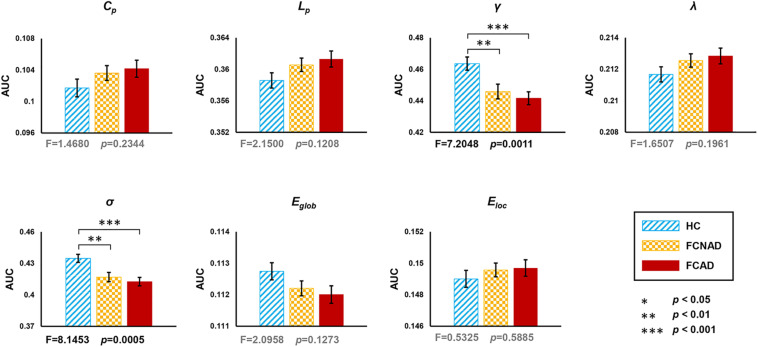
FIGURE 2.
Group effects for global network metrics (AUC, after Bonferroni correction, P < 0.05/7≈0.0071) by using the human Brainnetome Atlas (HBA). Patients with FCAD/FCNAD showed significantly lower γ and σ than those in the HC group. AUC, area under the curve; Cp, clustering coefficient; Lp, shortest path length; γ, normalized clustering coefficient; λ, normalized shortest path length; σ, small-world-ness; Eglob, global efficiency; Eloc, local efficiency; FCAD, functional constipation associated with anxiety/depressive status; FCNAD, functional constipation without anxiety/depressive status; HC, healthy control.

