FIGURE 4.
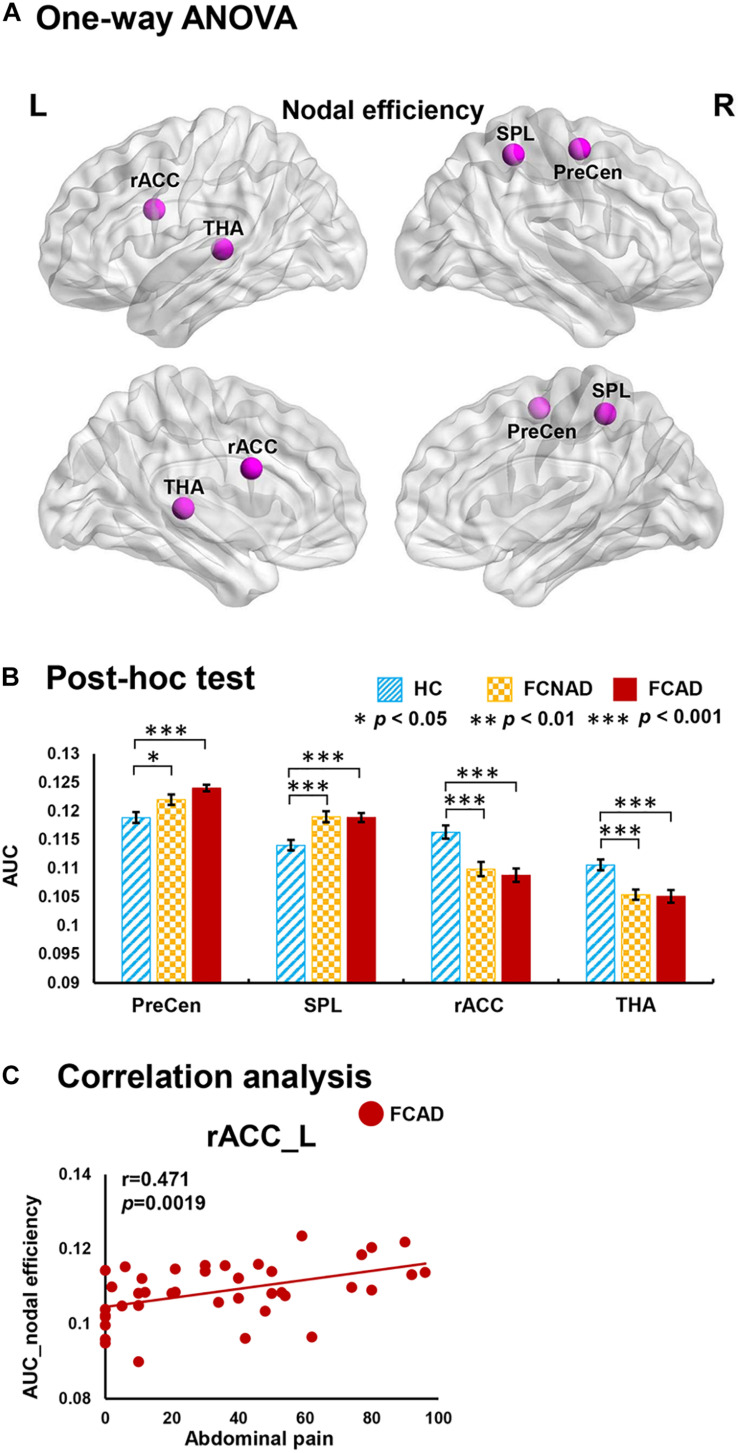
Group effects for nodal efficiency (AUC, PFDR < 0.05) by using the human Brainnetome Atlas (HBA). There were significant differences in the rACC, THA, SPL, and PreCen (A). Both FCAD and FCNAD had lower nodal efficiency than HC in the rACC and THA and higher nodal efficiency than HC in the PreCen and SPL (B). In the FCAD group, abdominal pain was positively correlated with nodal efficiency in the rACC (C). Images correspond to a 3D depiction of a see-through model of the areas in the brain, with darker colored ones indicating surface location and lighter colored ones indicating locations deeper in the brain. Nodes in pink represent significant group effect in nodal properties. AUC, area under the curve; PreCen, precentral gyrus; SPL, superior parietal lobule; rACC, rostral anterior cingulate cortex; THA, thalamus; FCAD, functional constipation associated with anxiety/depressive status; FCNAD, functional constipation without anxiety/depressive status; HC, healthy control; L, left; R, right.

