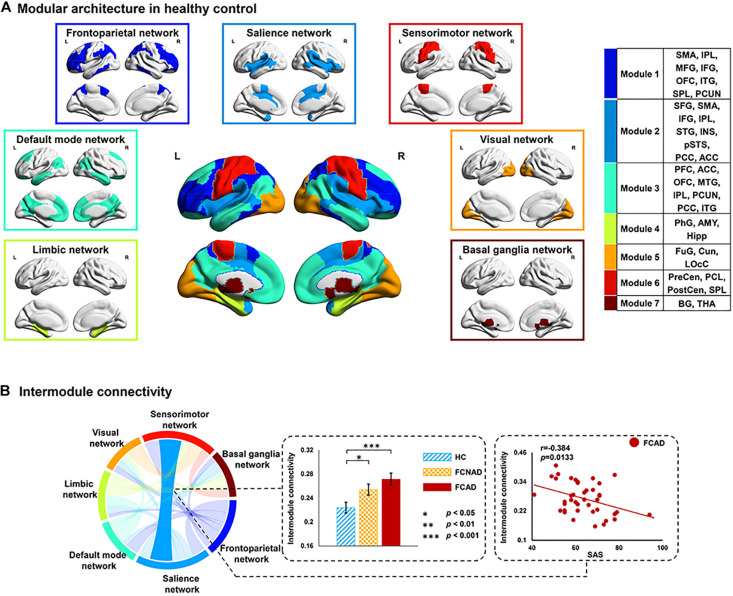
FIGURE 6.
Spatial distribution of network modules and connectivity between modules. (A) Modular membership of healthy controls; seven modules were identified for the group-averaged functional network. (B) Group effect on inter-module connectivity between salience and sensorimotor networks (AUC, PFDR < 0.05). Both FCAD and FCNAD had higher inter-module connectivity between salience and sensorimotor networks, which was negatively correlated with SAS in the FCAD group. AUC, area under the curve; SAS, ZUNG self-rating anxiety scale; FCAD, functional constipation associated with anxiety/depressive status; FCNAD, functional constipation without anxiety/depressive status; HC, healthy control; L, left; R, right.

