Figure 6.
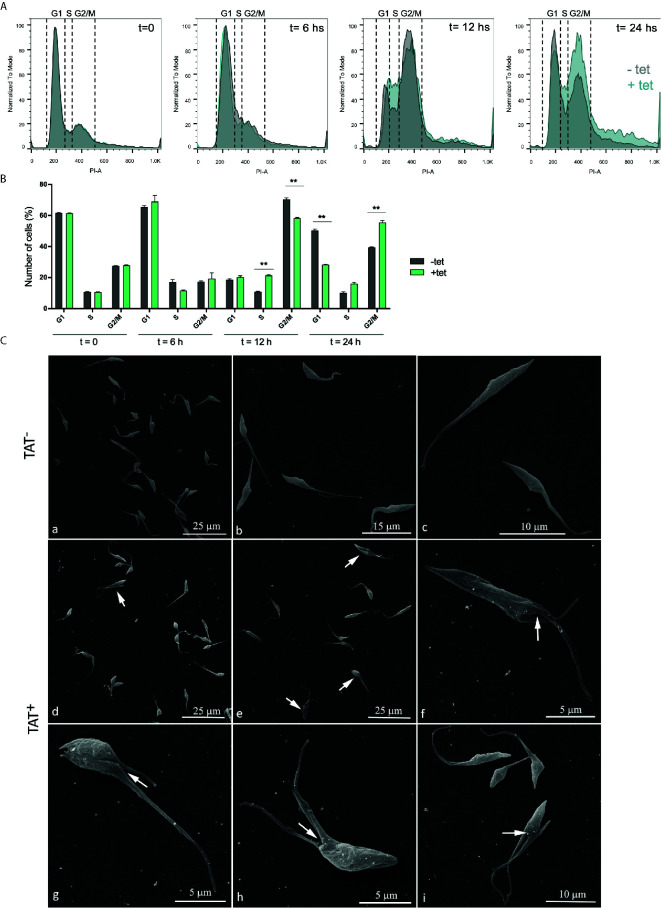
Hyperacetylation alters the cell cycle progression. (A) Flow cytometry analysis of synchronized Dm28c pTcINDEX-GW ATAT-HA epimastigotes in the absences (grey) and presence (green) of 0.5 μg/ml tetracycline at different time points. Histograms are plotted as the normalized number of events vs. propidium iodide absorbance (PI-A). (B) Bar graph with the percentages of cells in the different phases of the cell cycle. **p < 0.005 (Student’s t test). Cell number was plotted, and the presented data is the mean ± S.D. of three parallel independent cell cultures. Plots represent one of three experiments performed. (C) Images obtained by Scanning Electron Microscopy (SEM) of Dm28c pTcINDEX-GW ATAT-HA. Uninduced epimastigotes (TAT-) (a–c). Parasites induced with 0.5 μg/ml tetracycline for 24 h (TAT+) (d–i). Induced cells presented a phenotype that indicates cytokinesis arrest (d–e, arrows) and the interruption in the progression of the cleavage furrow (f–i, white arrows).

