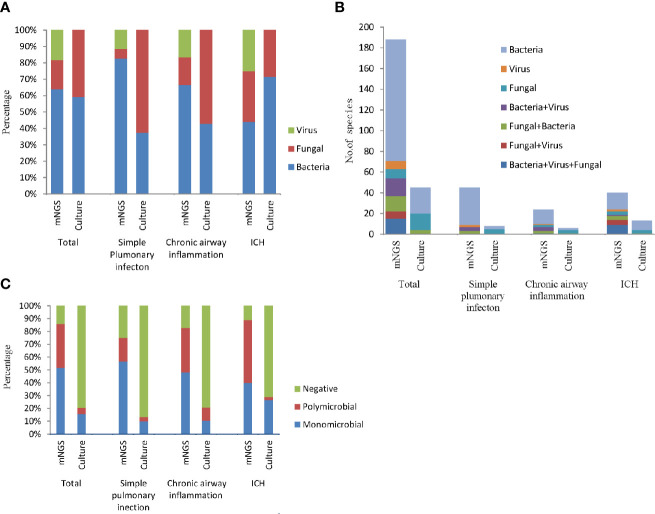
Figure 3.
The bar chart represented the infection types in patients with different underlying diseases according to the positive results of culture and mNGS. (A) Fraction of species (bacteria, fungi, and viruses) in different groups; (B) Number of infection type; (C) Proportion of polymicrobial, monomicrobial infection, and negative cases of pulmonary infection detected using mNGS and culture method.

