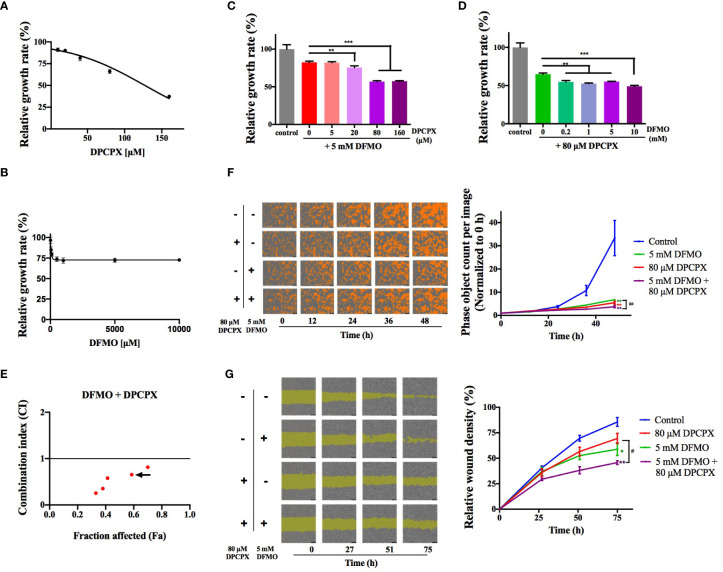
Figure 1.
DFMO and DPCPX synergistically inhibit the growth and proliferation of MCF-7 cells. The relative growth data of MCF-7 cells from the MTT assay are shown for DPCPX (A) and DFMO (B). Cells were seeded in 96-well plates and treated with 0–160 µM DPCPX or 0–10 mM DFMO for 48 h. Data are shown as mean ± SD (n = 3). (C) The relative growth of MCF-7 cells as determined by the MTT assay after the treatment with 5 mM DFMO and 0–160 µM DPCPX. Cells were seeded in 96-well plates and treated with the indicated inhibitors for 48 h. Data are shown as mean ± SD (n = 3). **p < 0.01; ***p < 0.001. (D) The relative growth of MCF-7 cells as measured by the MTT assay after treatment with 80 µM DPCPX and 0-10 mM DFMO. Cells were seeded in 96-well plates and treated with the indicated inhibitors for 48 h. Data are shown as mean ± SD (n = 3). **p < 0.01; ***p < 0.001. (E) The scatter plot of Combination Index (CI) versus fraction affected (Fa) based on the data from the MTT data. MCF-7 cells were treated with DFMO and DPCPX in the constant molar ratio 1:0.016. The CI and Fa values were calculated using the Chou-Talalay method with CompuSyn (24). CI > 1, CI = 1, CI < 1 represent antagonistic, additive, and synergic effects, respectively. The arrow marks the combination of 5 mM DFMO and 80 µM DPCPX (CI = 0.65). (F) Representative images from the cell proliferation assay performed on an IncuCyte S3 Live-Cell Analysis System (Essen BioScience, USA). Cells were seeded in 96-well plates and treated with the indicated dose combinations of DFMO and DPCPX. Cells are shown in orange. The quantified proliferation data with the IncuCyte ZOOM software are shown on the right as mean ± SD (n = 3). **p < 0.01 compared to the control group; ## p < 0.01 compared to the DFMO group. (G) Representative images from the wound healing assay performed on an IncuCyte S3 Live-Cell Analysis System. Cells were seeded in 96-well plates and treated with indicated dose combinations of DFMO and DPCPX. The quantified relative wound densities from the IncuCyte ZOOM software are shown on the right as mean ± SD (n = 3). * and ** indicate p < 0.05 and p < 0.01 respectively compared to the control group. # p < 0.05 compared to the DPCPX group.

