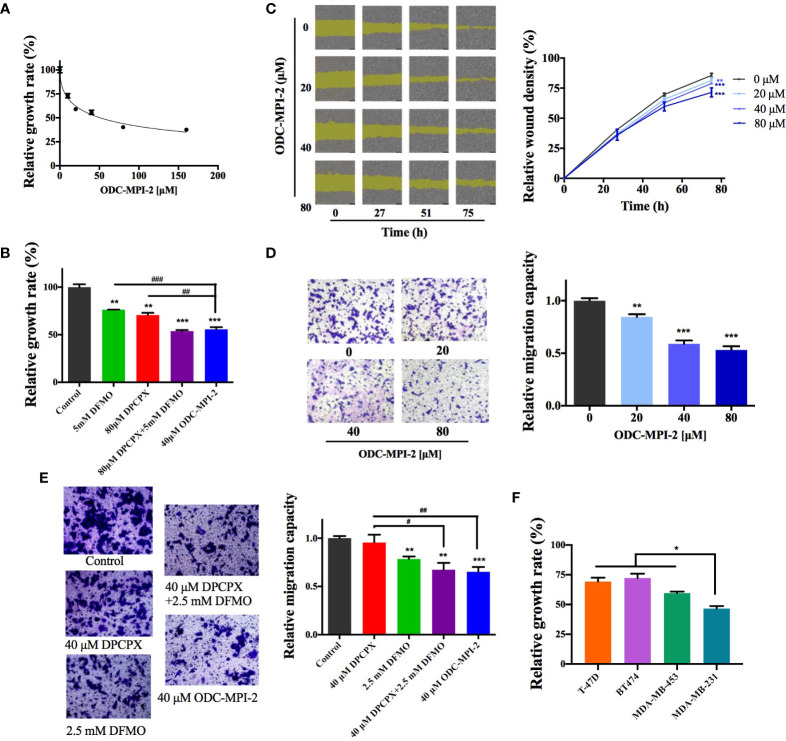
Figure 4.
ODC-MPI-2 has good antitumor potency on breast cancer cell lines. (A) Relative growth of MCF-7 cells as measured by the MTT assay after treatment of ODC-MPI-2. Cells were seeded in 96-well plates and treated with 0-160 μM ODC-MPI-2 for 48 h. Data are shown as mean ± SD (n = 3). (B) Relative growth of MCF-7 cells as measured by the MTT assay after the treatment of different inhibitors. Cells were seeded in 96-well plates and treated with 5 mM DFMO, 80 μM DPCPX, or 40 μM ODC-MPI-2 for 48 h. Data are shown as mean ± SD (n = 3). ** and *** indicate p < 0.01 and p < 0.001 respectively compared to the control group. ## and ### indicate p < 0.05 and p < 0.01 respectively compared to the ODC-MPI-2 group. (C) Representative images from the wound healing assay obtained from an IncuCyte S3 Live-Cell Analysis System (Essen BioScience, USA). Cells were seeded in 96-well plates and treated with 0–80 μM ODC-MPI-2. The relative wound densities were quantified with the IncuCyte ZOOM software and shown on the right as mean ± SD (n = 3). ** and *** indicate p < 0.01 and p < 0.001 respectively compared to the 0 μM group, which is a same control used in Figure 2G . (D) Cell migration studies of MCF-7 cells treated with ODC-MPI-2 from the Transwell assay. The cells were treated by 0-80 μM ODC-MPI-2 for 24 h. The representative images are shown on the left and the quantified data on the right. Data are shown as mean ± SD (n = 5). ** and *** indicate p < 0.01 and p < 0.001 respectively compared to the 0 μM group. (E) The cell migration capacity of MCF-7 cells treated with DFMO, DPCPX, and ODC-MPI-2 from the Transwell assay. The representative images are shown on the left and the quantified data on the right. Data are shown as mean ± SD (n = 5). **and ** indicate p < 0.05 and p < 0.01 respectively compared to the control group. ## and ### indicate p < 0.01 and p < 0.001 respectively compared to the 40 μM ODC-MPI-2 group. (F) Relative growth of different breast cancer cells as measured by the MTT assay after treatment with ODC-MPI-2. Cells were seeded in 96-well plates and treated with 40 μM ODC-MPI-2 for 48 h. The Data are shown as mean ± SD (n = 3). *p < 0.05 compared to the MDA-MB-231 group.

