Figure 3.

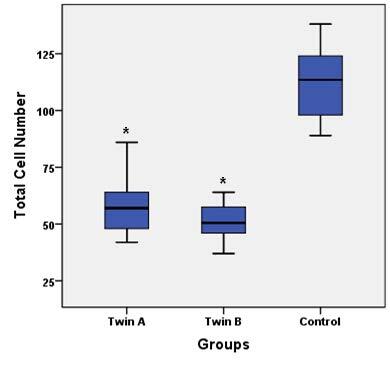
Total cell number of blastocysts compared between groups. There were significant differences between twins A and twins B with control groups (*P < 0.0001). Data are presented as mean ± SD.

Total cell number of blastocysts compared between groups. There were significant differences between twins A and twins B with control groups (*P < 0.0001). Data are presented as mean ± SD.