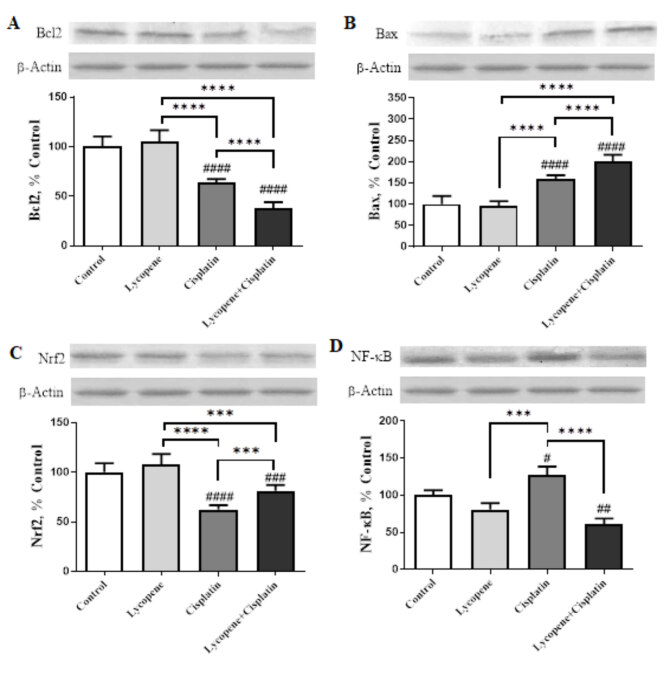
Figure 2.
The effects of lycopene treatment on the levels of Bcl-2 (A), Bax (B), Nrf2 (C), and NF-κB (D) protein expression as detected by Western blotting analysis of HeLa cells. The band intensities were measured using densitometric analysis. The data were presented as a ratio of treatment value to control value set at 100%. The bar represents the mean and standard error of the mean. Western blots were repeated at least four times. β-actin was used as a loading control protein for Western blotting analysis (ANOVA and Tukey’s post hoc test statistical significance between groups is shown by # P < 0.05, ## P < 0.01, ### P < 0.001, #### P < 0.0001 relative to control group; *** P < 0.001, **** P < 0.0001 shows comparison between each treatment group).

