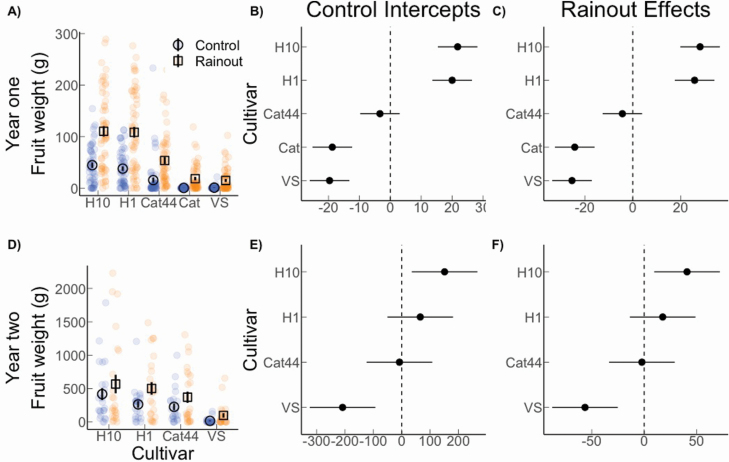
Figure 4.
Fruit weight 18 months (A) and 30 months (D) after planting was positively affected by the rainout treatment across the cultivars. The coefficient plots for control intercepts (B, E) and rainout effects (C, F) show the estimates as offsets from the overall mean (for more detail, see Supporting Information Tables S1 and S2). Where the 95 % confidence interval does not overlap 0, we can infer that the estimate differed significantly from the mean.

