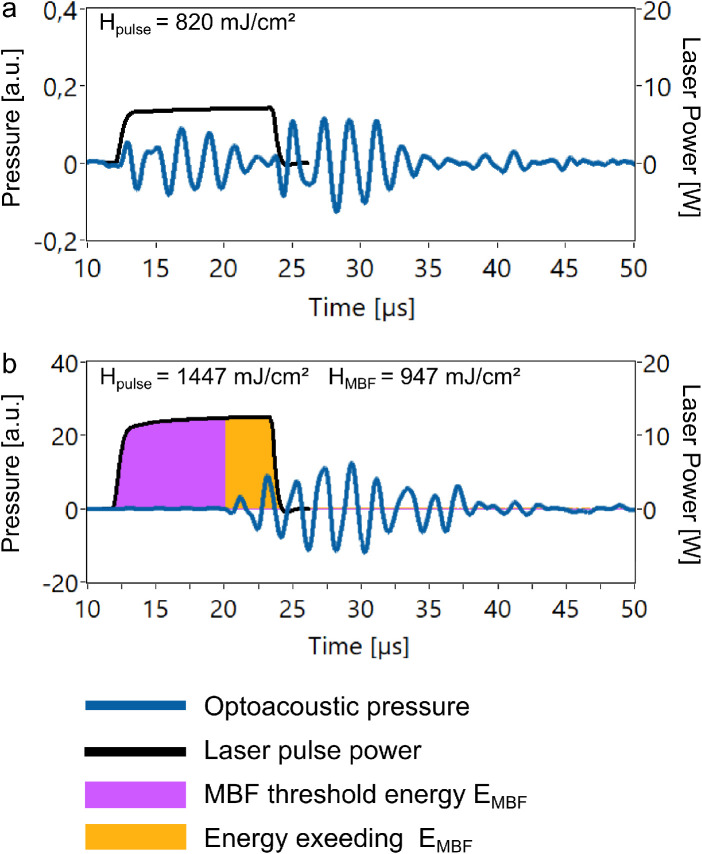
Figure 2.
Examples of optoacoustic transients (blue) below (a) and above (b) the threshold for MBF. The laser pulse is displayed in black. The laser pulse was shifted temporally by the acoustic transit time for better understandability. The purple area under the pulse represents the laser pulse energy until threshold for MBF, the orange area represents the laser pulse energy for additional heating. Note the 100 times larger pressure amplitudes for MBF in (b).

