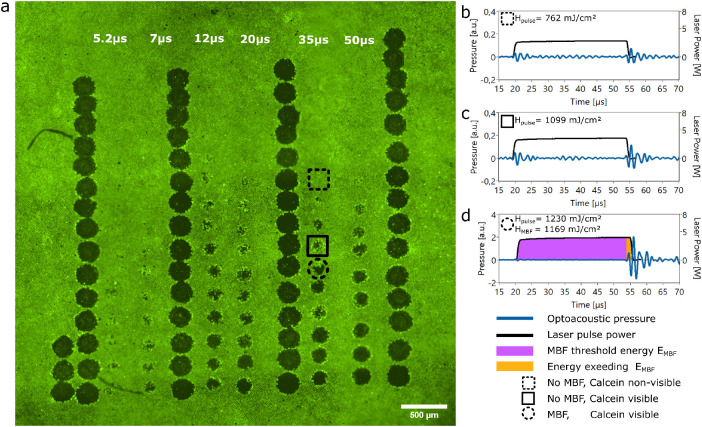
Figure 3.
(a) Fluorescence microscopic image of a calcein viability stained probe. Four columns of strong marker lesions were placed, in between six columns of spots with different pulse durations in each column. Laser energy was always increased from the upper to the lower part of the column. In the 35-µs column, three spots are highlighted and their laser pulse shapes and acoustic transients are shown in subfigures b–d. The dashed square (b) displays an undamaged area, the last in the column. The spot highlighted with the solid square is the last spot without detectable MBF (c). The spot with the dashed circle is the first spot with MBF (d), indicated by the 20 times higher acoustic amplitude compared to (a) and (b).

