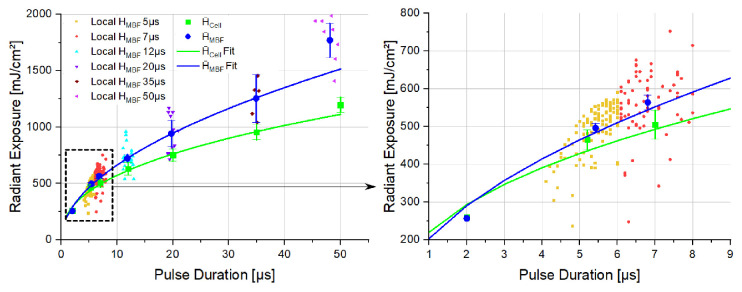
Figure 4.
Threshold radiant exposures over pulse duration for ex vivo specimen. Points indicate local HMBF values used for calculation of the interindividual value. Larger points with error bar display (green rectangles) and (blue dots). Error bars show the 95% confidence interval. The dashed area is magnified in the right plot.

