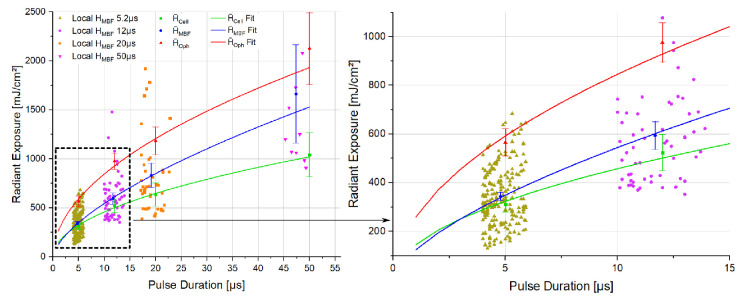
Figure 6.
Threshold radiant exposures over pulse duration in vivo. Small dots represent local HMBF values of individual spots. Points with error bar display interindividual (mean) threshold values of FA visible cell damage (green rectangles), MBF (blue dots), and ophthalmoscopic visibility (red triangles). Lines show a fit function. The dashed area is magnified in the right plot.

