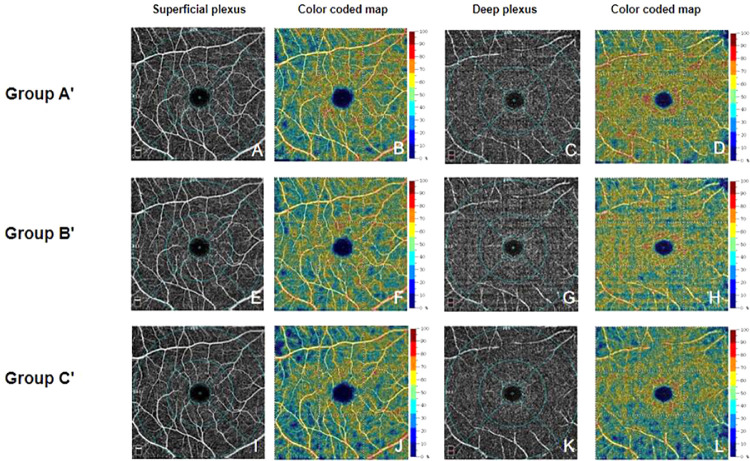
Figure 3.
Representative OCTA macula images of each group after ICRT. (A–D) Images of volunteers without a mask. (E–H) Images of volunteers with a surgical mask. (I–L) Images of volunteers with an N95 mask. A, E, and I show the superficial plexus layer; C, G, and H show the deep plexus layer. B, F, J, D, H, and L show calculated blood flow, from low to high (indicated by blue to red). From A, the foveal region is defined as a circle centered on the macula, surrounded by a 1-mm diameter blue circle; the parafoveal region is defined as an annulus centered on the fovea, with an outer diameter of 3 mm and an inner diameter of 1 mm (indicated by blue circles); the perifoveal region is defined as an annulus centered on the fovea, with an outer diameter of 6 mm and an inner diameter of 3 mm (indicated by blue circles). All parameters were measured automatically.

