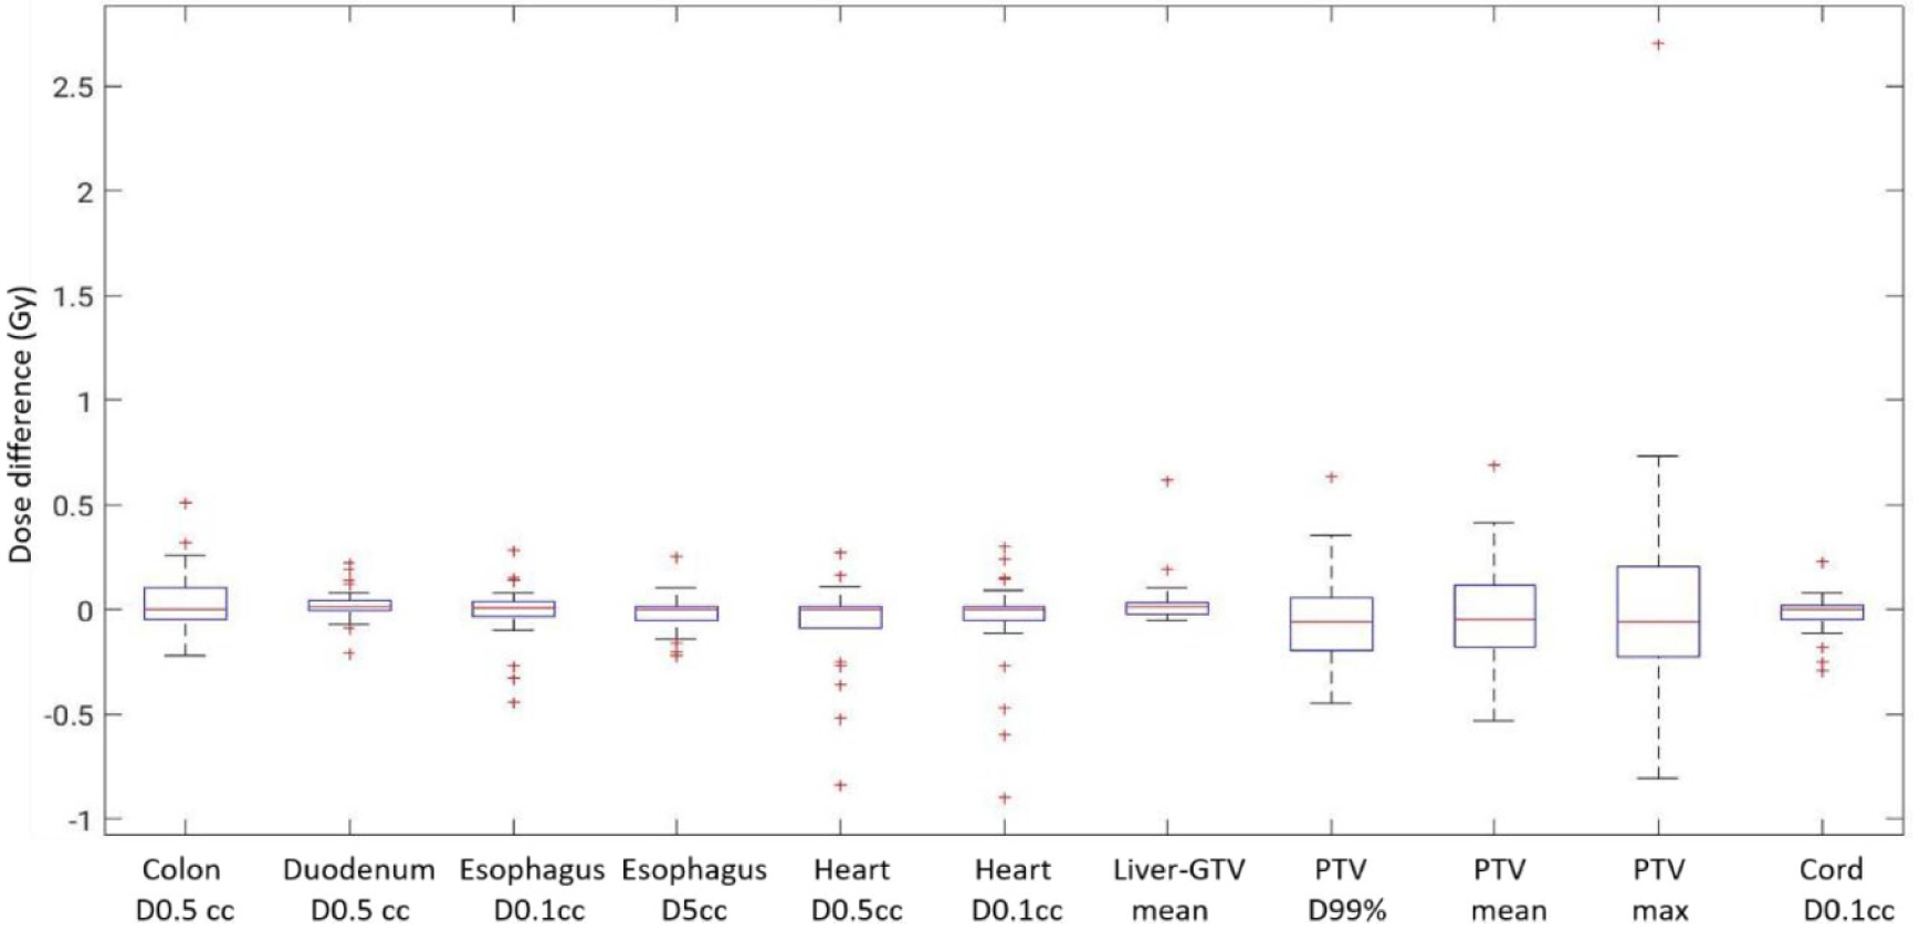
Figure 11.

Dose differences between CT plans and synthetic CT recalculations for OARs and PTV. Box and whisker plots show the median (center-line), 75th percentile (top of box), 25th percentile (bottom box), max and min (whisker ends) and outliers (‘+’ symbol).
