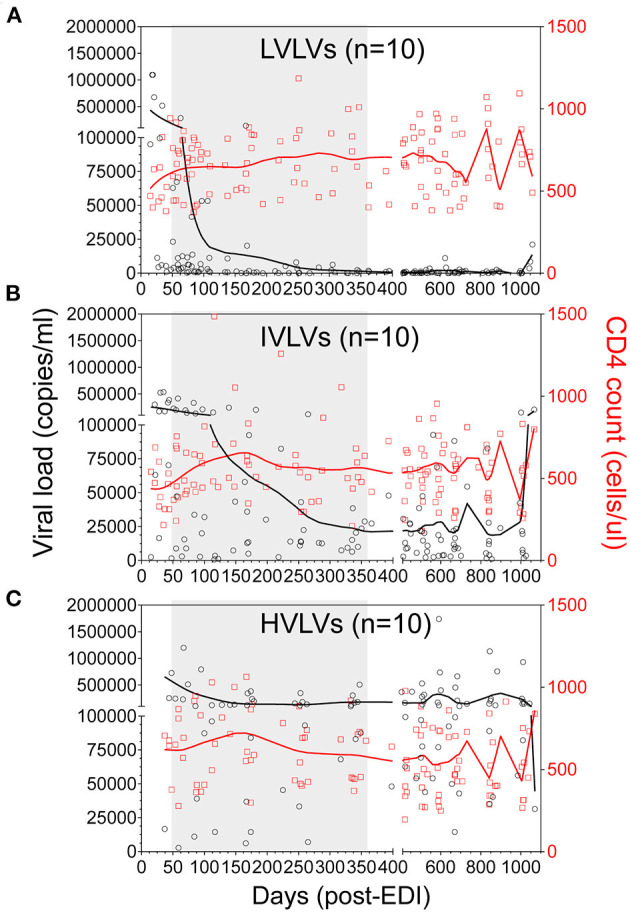
Figure 4.

Locally weighted scatterplot smoothing (LOWESS) curves showing the overall trend in VL (black circles) and CD4 counts (red squares) for Low viral load volunteers (LVLVs) (A), Intermediate viral load volunteers (IVLVs) (B) and High viral load volunteers (HVLVs) (C) over 36 months post infection. N = 10 for each group. The shaded region indicates the dynamic period of immune control observed in the LVLVs following peak viraemia.
