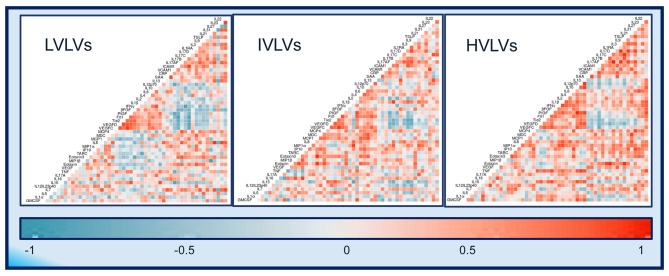
Figure 5.
Correlograms of the correlations between 52 plasma protein concentrations for Low viral load volunteers (LVLVs), Intermediate viral load volunteers (IVLVs) and High viral load volunteers (HVLVs). Blue and red squares represent positive and negative correlations, respectively with darker colours indicating a greater magnitude of correlation.

