Figure 5.
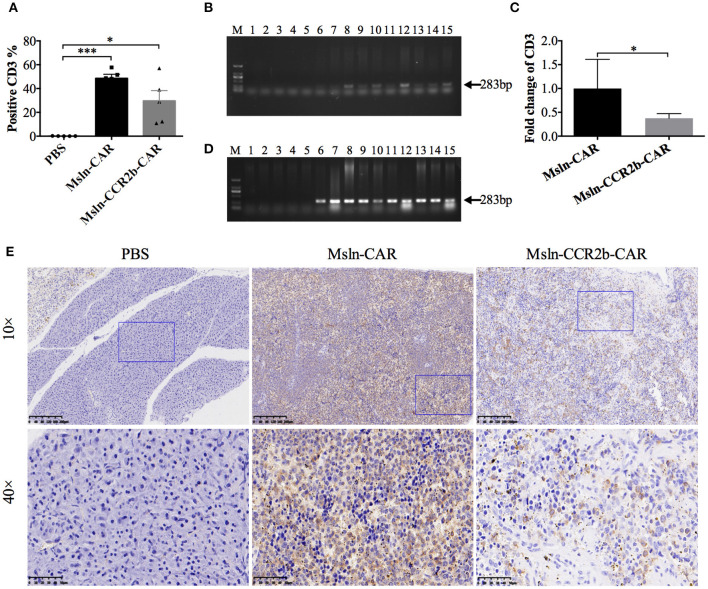
Persistence and proliferation of CAR T cells in vivo. (A) Peripheral blood analysis of the proportion of CAR T cells 28 days post-tumor implantation by FACS. One hundred microliters peripheral blood was collected from mouse orbit, and proportion of CAR T cells was detected with PE-conjugated anti-CD3 antibody after the red blood cell lysis. Statistical differences were analyzed by one-way ANOVA, and data represented the means ± SEM. Experiments were repeated for three times. *P < 0.05 and ***P < 0.001. (B) Peripheral blood analysis of persistence of CAR T cells 28 days post-tumor cells implantation by PCR. One hundred microliters peripheral blood was collected from mouse orbit, and genomic DNA were extracted after the red blood cells lysis. PCR was performed with the specific primers designed for anti-Msln scFv. The expected positions (283 bp) of the resulting DNA bands were indicated by an arrow at the right of the gel. M, DNA marker; lanes 1–5, amplicons for representative 5 mice injected with PBS; lanes 6–10, amplicons for representative 5 mice injected with Msln-CAR T cells; lanes 11–15, amplicons for representative 5 mice injected with Msln-CCR2b CAR T cells. (C) Genomic DNA from PBMC of Msln-CAR and Msln-CCR2b-CAR-treated mice were subjected to qPCR with specific primers for anti-Msln scFv and GAPDH. Experiments were repeated for three times. Error bar represented ± SEM and P-value was calculated by Student's t-test. *P < 0.05. (D) Organic analysis of persistence of CAR T cells 28 days post-tumor cells implantation by PCR. Major organs (heart, liver, spleen, lung, and kidney) were dissected from mice treated with PBS, Msln-CAR, or Msln-CCR2b-CAR T cells and genomic DNA were extracted. PCR was performed with specific primers designed for anti-Msln scFv. Expected positions (283 bp) of the resulting DNA bands were indicated by an arrow at the right of the gel. M, DNA marker; Lanes 1–15 represent amplicons for heart, liver, spleen, lung, and kidney of representative 3 mice injected with PBS (lanes 1–5), Msln-CAR T (lanes 6–10), or Msln-CCR2b-CAR T cells (lanes 11–15), respectively. (E) Spleens of PBS, Msln-CAR, or Msln-CCR2b-CAR-treated mice were stained with specific rabbit anti-human CD3 mAb and HRP-conjugated goat anti-rabbit IgG H&L. The rectangular area in the 10× picture was enlarged to 40×. Scale bars: 200 μm for 10×, 50 μm for 40×.

