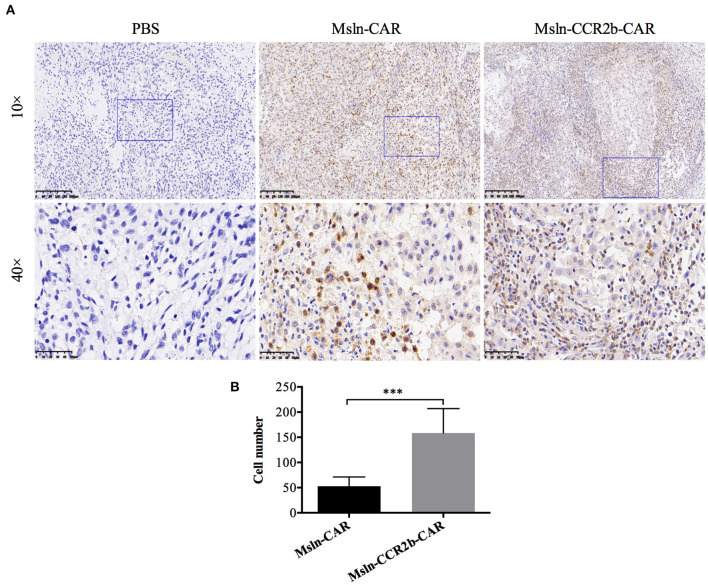
Figure 6.
CCR2b increased migration and infiltration of Msln-CAR T cells into tumor tissue. (A) Paraffin sections of tumors from three groups were stained with specific rabbit anti-CD3 mAb and HRP-conjugated goat anti-rabbit IgG H&L. CD3 T cells were detected in the tumor region of Msln-CAR group and Msln-CCR2b-CAR group whereas no CD3 T cells were observed in the tumor mass of PBS group. The rectangular area in the 10× picture was enlarged to 40×. Scale bars: 200 μm for 10×, 50 μm for 40×. (B) Four fields of tumor sections were randomly selected, and positive CD3 T cells (yellow) were enumerated manually using the multi-point cell counter of Image J. Data were representative of the means ± SEM. P-value and statistical differences were analyzed by Student's t-test. ***P < 0.001.

