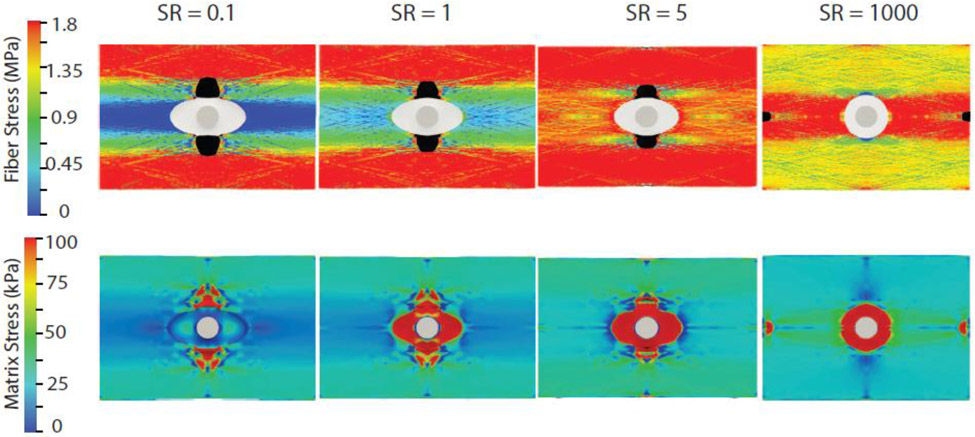
Fig. 8.
Distribution of collagen fiber nominal stress (top) and non-collagenous matrix Cauchy stress (bottom) at peak stress for four different cases of SR (): 0.1, 1 5, 1000. Failed fibers are highlighted in black. Only maximum principal Cauchy stress, which is in the loading direction, is shown in the matrix (bottom)

