


Extended Data Figure 7. Western blot of VLPs produced from untreated HEK293T cells (WT) or HEK293T cells treated with 4 μM lovastatin.
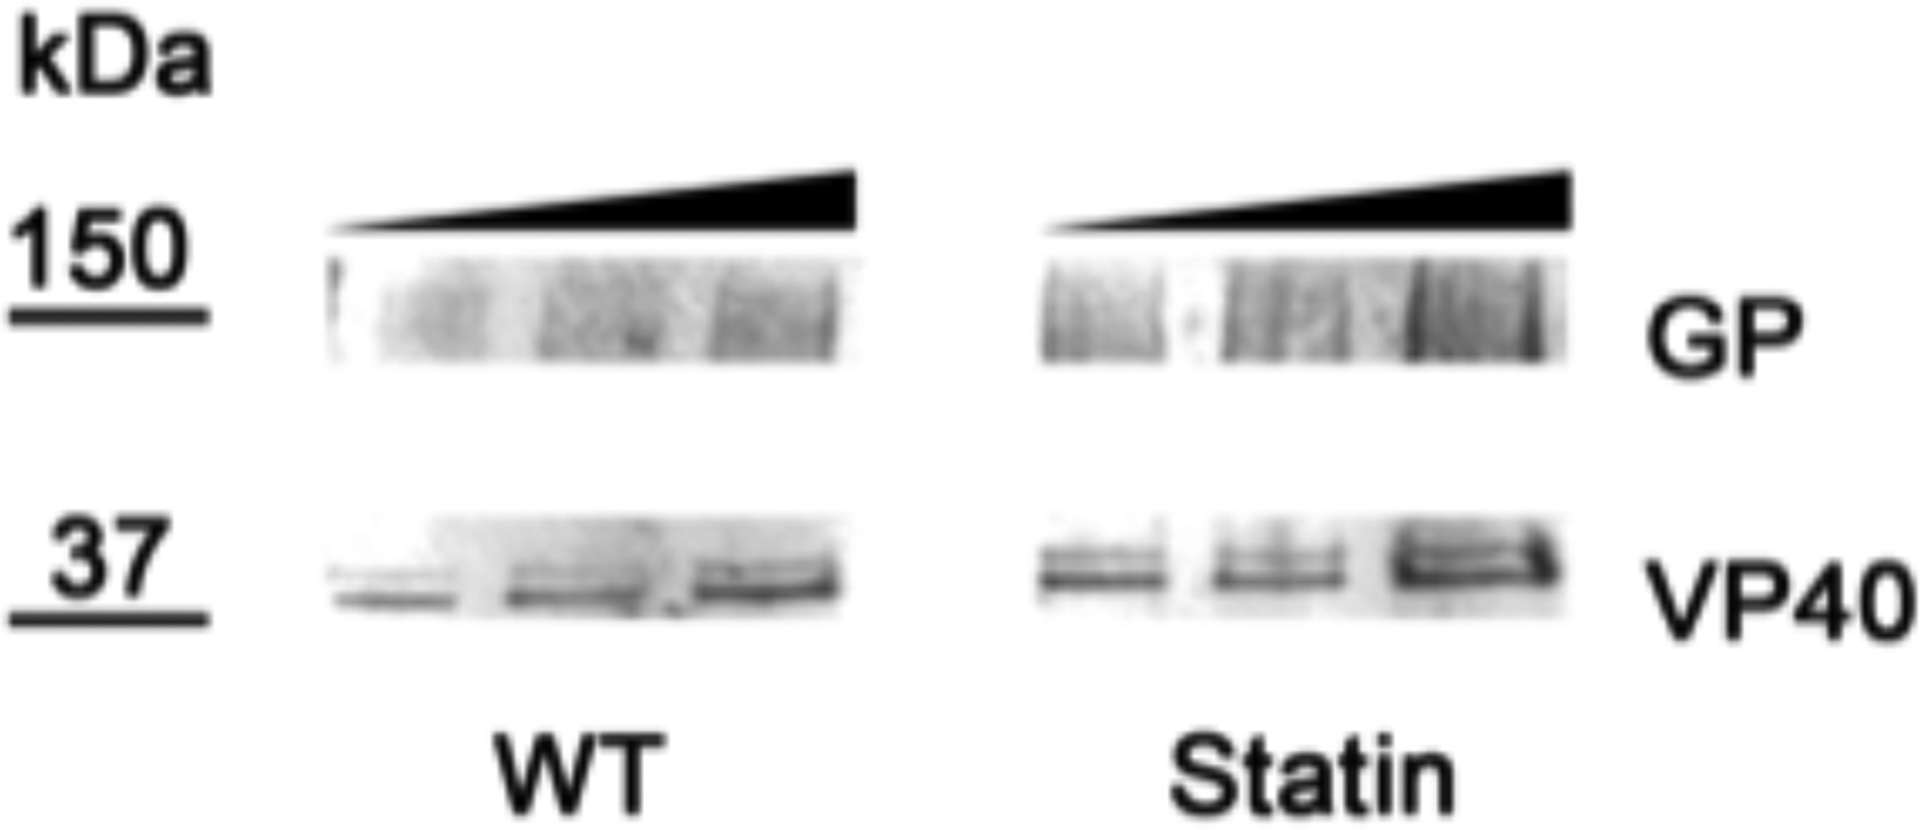
1, 2, and 5 μg of each type of VLP was applied to the gel. After probing for EBOV GP and VP40 (see Methods), the relative amounts of GP to VP40 were calculated for each lane. When normalized to WT VLPs, the ratio of GP:VP40 in Statin VLPs was 1.1 +/− 0.07 that in WT VLPs based on analysis of all lanes. The ratio was 0.86 +/− 0.07 based on analysis of the last 2 lanes of each gel. VLPs produced in cells treated with 20 or 50 μM lovastatin (statin) showed reduced GP incorporation (see ref 41).