
Figure 5. The cholesterol dependence of fusion.
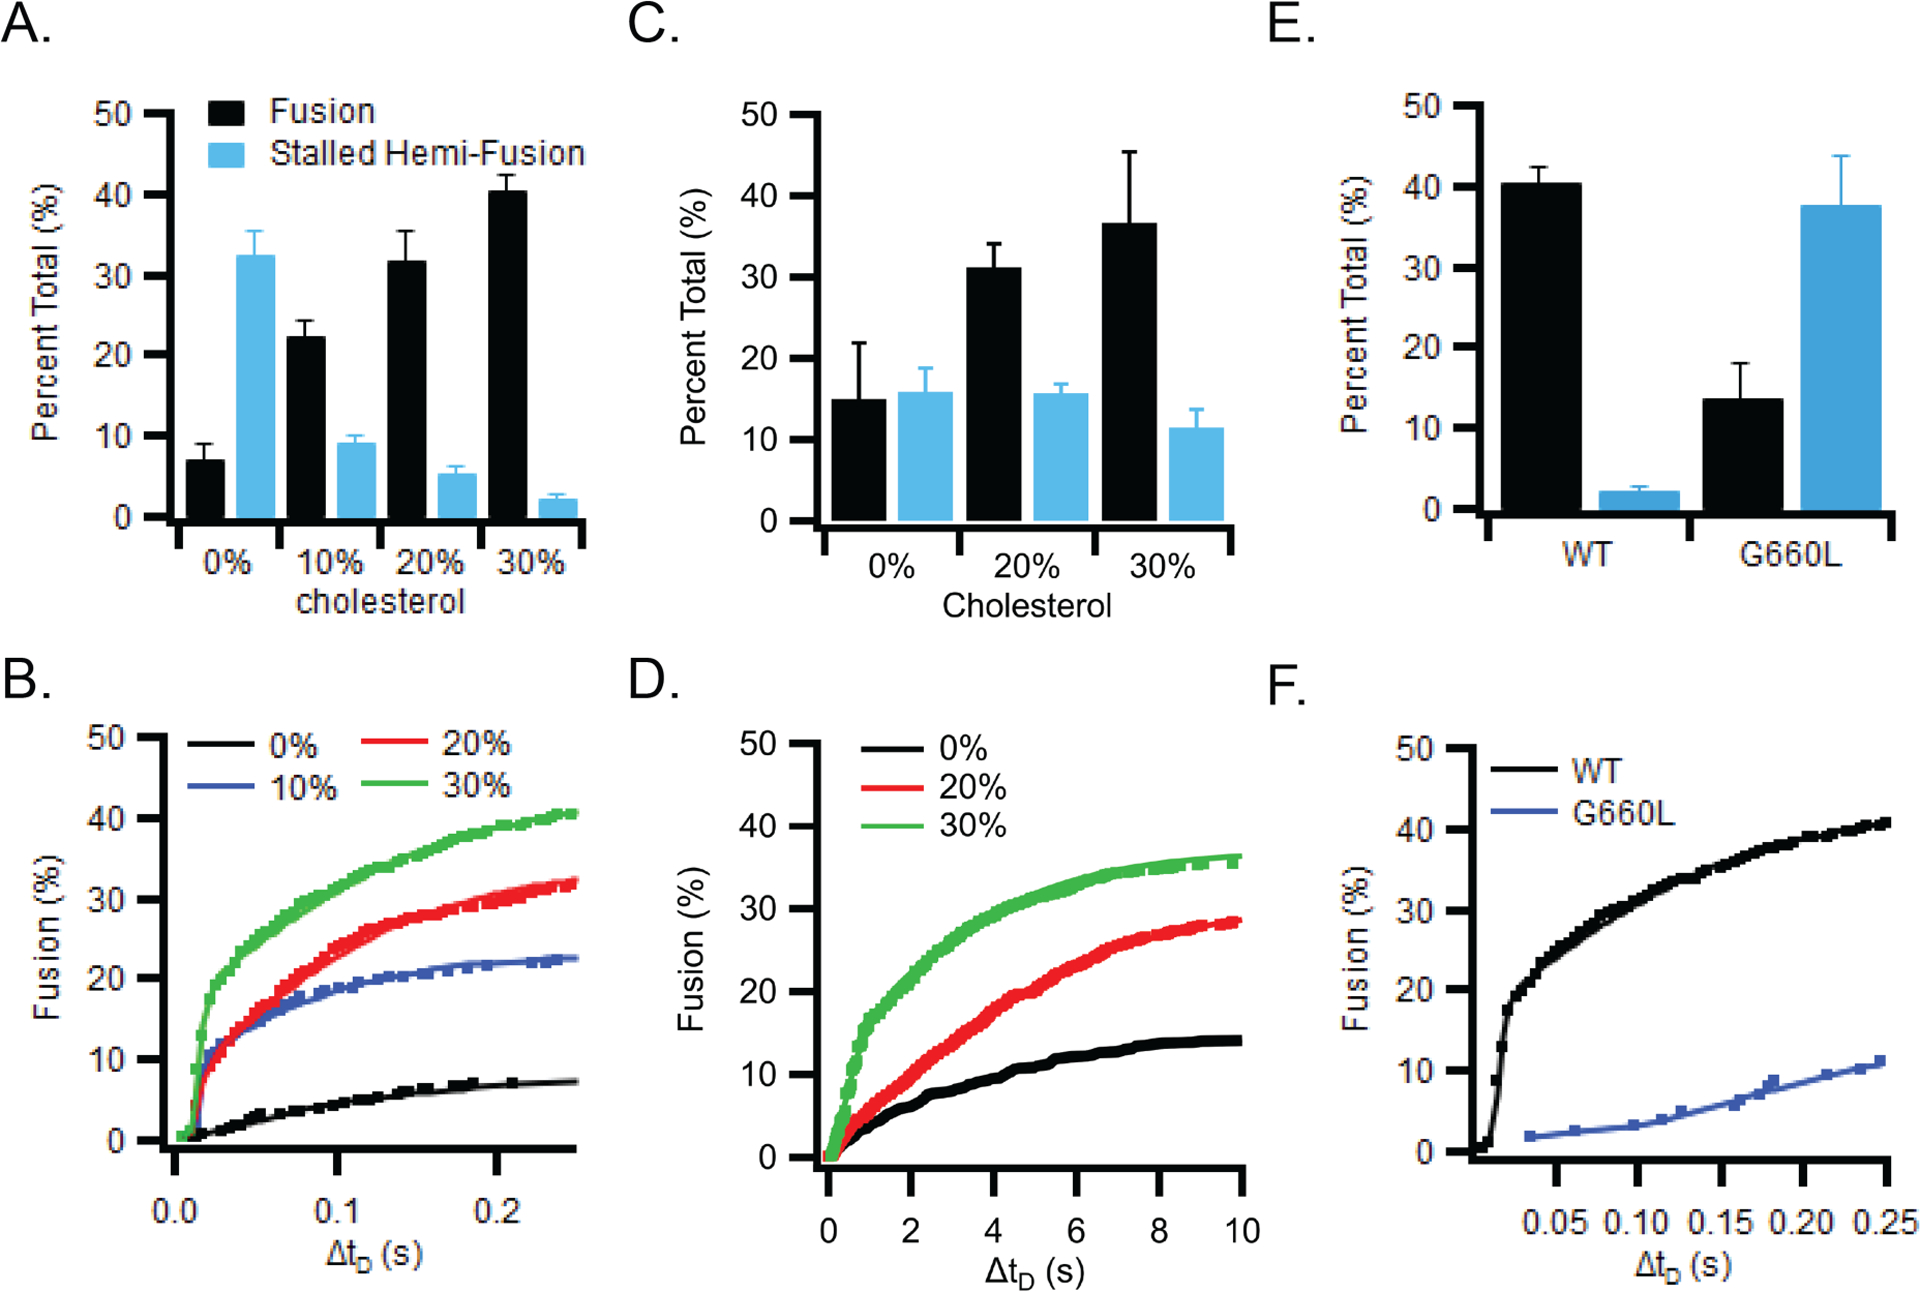
(A) Fusion of liposomes (50 nm diameter) with supported bilayers containing GP2 (lipid:protein ratio of 1000) and increasing amounts of cholesterol. (B) Cumulative distribution of the delay times from the time of binding until the time of fusion of liposomes to GP2-containing supported bilayers with increasing amounts of cholesterol. (C) Fusion of GP2-proteolipsomes (100 nm diameter, POPC plus 1 mol% Rh-DOPE) plus 0, 20, or 30 mol% cholesterol with protein-free supported bilayers (77:20:3 POPC:Chol:DPS). (D) Cumulative distribution of fusion delay times for GP2 proteoliposomes with 0, 20, or 30 mol% cholesterol. (E) Fusion of liposomes to supported bilayers containing wt (black) or G660L (blue) GP2. (F) Cumulative distribution of the delay times from the time of binding until the time of fusion for liposomes to supported bilayers containing wt (black) or G660L (blue) GP2. Bar graphs in panels A, C and E show mean and s.e.m. from 3–6 independent experiments under each condition. Typically, 1000–2000 particles were collectively counted in these experiments. The kinetic fusion data in panels B, D, and F were collected from the same experiments pooling all approximately 1000–2000 events from the 3–6 independent bilayers under each condition. Data including number of repeats and particles measured under each condition are available as Source Data.