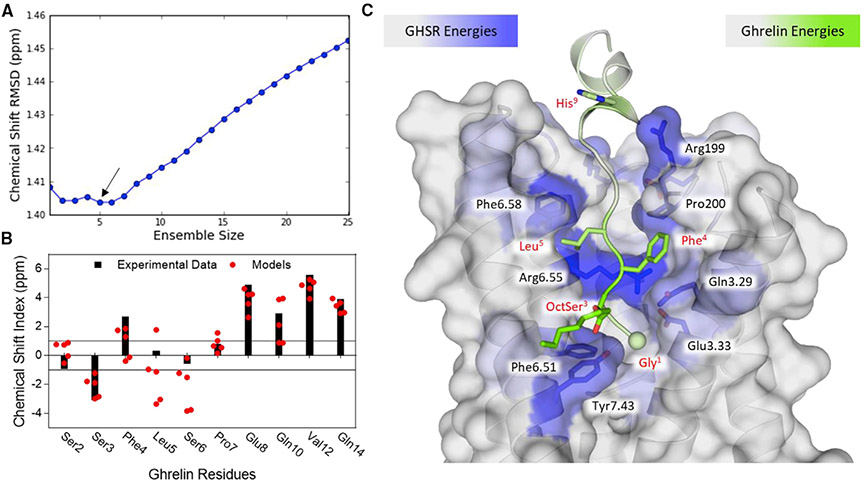
Figure 3. Rosetta Modeling of Ghrelin at GHSR.
(A) Identification of ensemble by comparison with experimental chemical shift root-mean-square deviation (RMSD) in ppm. The minimum RMSD and smallest ensemble required five models (highlighted with an arrow).
(B) Comparison of the chemical shift index between the experimental data points and the five-model ensemble. Black bars correspond to the experimental CSI and red circles show the CSI for each model in the ensemble.
(C) A representative model of ghrelin binding at GHSR (TM 1 and 2 are removed for clarity). Residues are colored according to the predicted binding energies with green corresponding to strong energies in ghrelin and blue corresponding to strong energies in GHSR. The N-terminal nitrogen is shown as a sphere. The side chains shown represent those that contribute the most to binding energy.
See also Figures S3 and S4 and Table S3.

