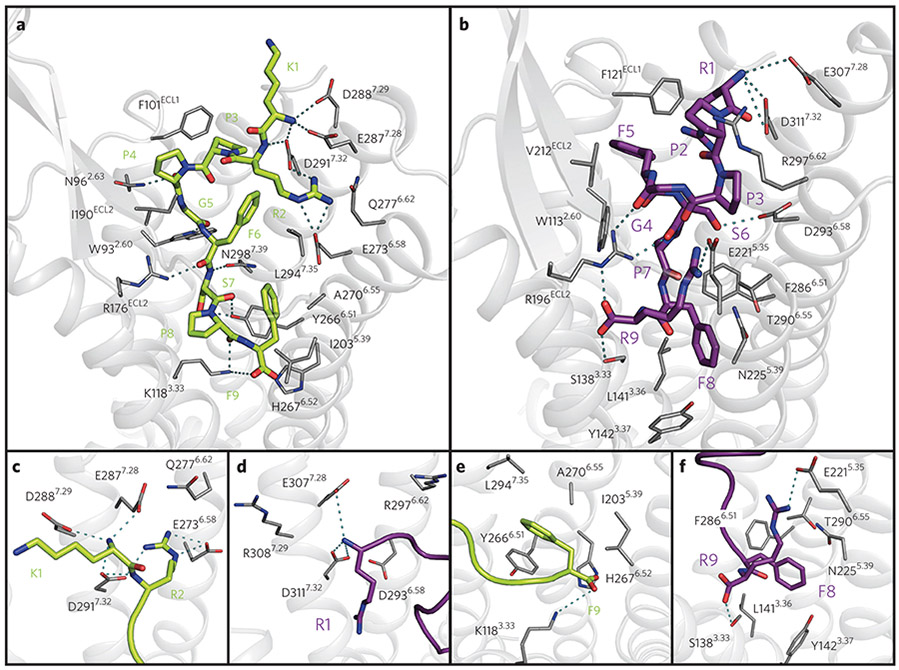
Figure 5 ∣. Structural characterization of the B1R–DAKD (green) and B2R–BK (purple) binding pocket.
(a) Top view of DAKD docked to a comparative model of B1R. (b) Top view of BK docked to a comparative model of B2R. (c) Side view of the DAKD and (d) BK N-terminal binding site at TMH VI and VII. (e) Side view of the DAKD and BK (f) C-terminal binding site between TMH3, 5 and 6. The ligand is shown as thick sticks. Receptor residues predicted to be involved in ligand binding are labeled and are shown as thin sticks. Predicted interactions are indicated by dotted cyan lines. Atoms are colored by type (oxygen, red; nitrogen, blue; sulfur, yellow).

