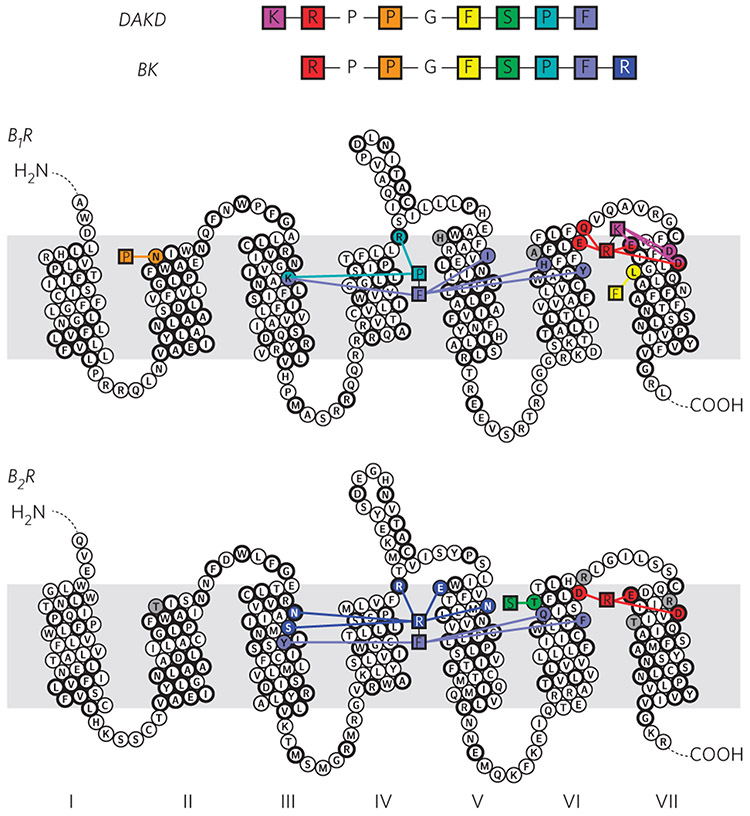
Figure 6 ∣. Representation of key interactions responsible for high affinity binding of DAKD to B1R and of BK to B2R.
B1R discriminates between DAKD and BK mainly via electrostatic interactions at the N terminus, whereas B2R selects via a complex interaction network as a result of different C-terminal structures of the BK and DAKD. The residues conserved among B1R and B2R are shown in bold circles.

