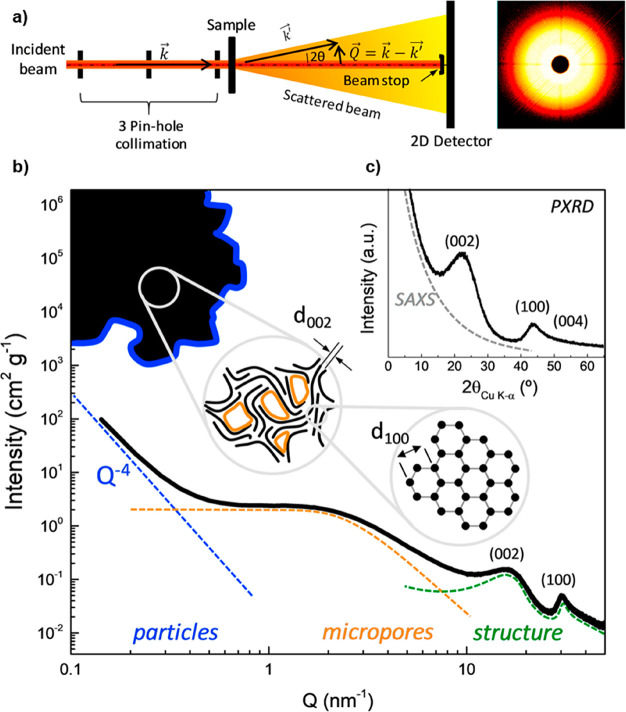
Figure 14.
Example SAXS experiment to study the structure of a microporous nongraphitic carbon material. (a) Schematic showing the normal setup of a SAXS instrument. (b) Intensity versus scattering vector curve plot (log–log scale), highlighting morphological (low Q ranges), microstructural (intermediate Q ranges), and structural (large Q ranges) features of the material probed by the technique. (c) Intensity versus scattering angle 2θ plot (linear scale) of the same spectrum, which is normally used for PXRD. Reprinted with permission from ref (306) under a CC BY-NC-ND 4.0 International License. Copyright 2019 Elsevier.

