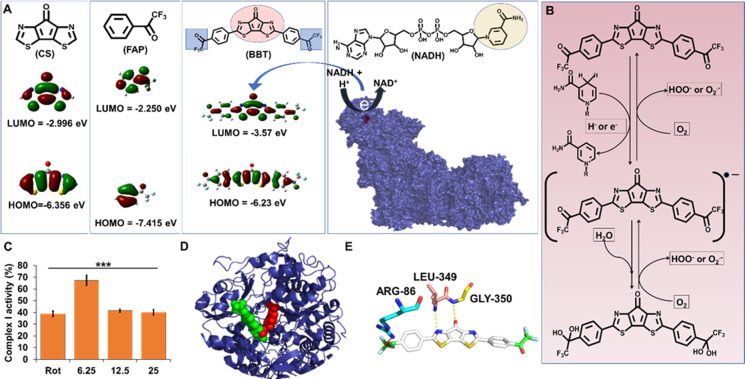
Figure 2.
Electron accepting power of BBT modulates the mitochondrial complex I function. (A) Diagrammatic representation of the molecular structure and HOMO/LUMO energy levels of CS, FAP, and BBT. Molecular docking image of FMN (red) in complex I (blue). (B) Diagrammatic illustration of the molecule having 1,4-dihydropyridine-3-carboxamide that can transfer the electron to the BBT to form its intermediate, which reversely transfers the electron to oxygen to form reactive oxygen species. (C) Complex I activity analysis in the presence of rotenone (Rot; 12.5 μM) and BBT (6.25, 12.5, and 25 μM). Data are shown as means ± SD and have been analyzed using one-way ANOVA (***p < 0.0001). (D) Molecular docking of BBT (green) with mitochondrial complex I (blue), where the FMN is represented as red spheres. (E) Molecular interaction of BBT with different amino acids of complex I, which is near to the FMN site. FMN: flavin mononucleotide, HOMO: highest occupied molecular orbital, and LUMO: lowest unoccupied molecular orbital.

