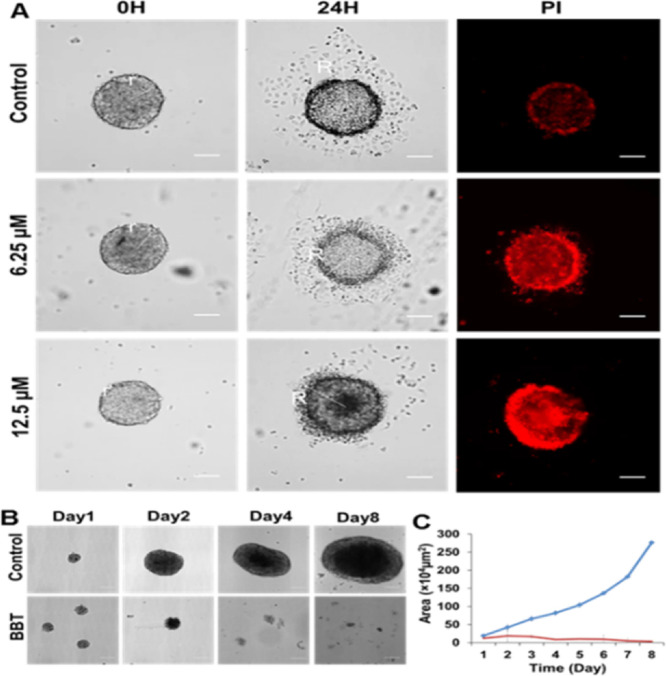
Figure 6.
BBT inhibits both migration and growth of tumor spheroid. (A) Microscopic image analysis of cell migration from the HeLa cell spheroid after treatment with 0, 6.25, and 12.5 μM concentrations of BBT. Dead cells were stained with PI. Scale bars correspond to 100 μm. (B) DIC images represent the growth of 3D spheroid HeLa cells incubated with 12.5 μM BBT up to a period of 8 days. Scale bars correspond to 100 μm. (C) Growth kinetics curve of the HeLa spheroid after treatment with 0 (blue) and 12.5 μM (red) BBT for 8 days. Data are shown as means ± SD. All experiments have been performed thrice (n = 3).

