Figure 3.

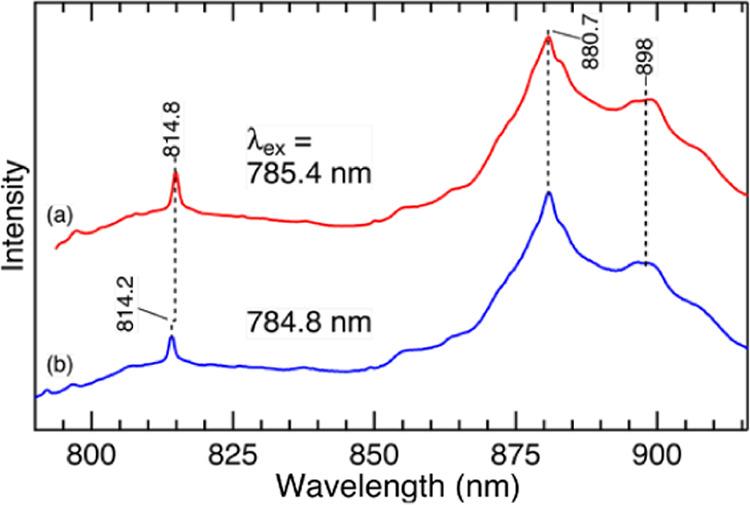
Raman/luminescence spectra of a glazed porcelain sample with 785.4 and 784.8 nm excitation. The spectra were measured at the surface of the sample. The horizontal axis was shown as the absolute wavelength (nm).

Raman/luminescence spectra of a glazed porcelain sample with 785.4 and 784.8 nm excitation. The spectra were measured at the surface of the sample. The horizontal axis was shown as the absolute wavelength (nm).