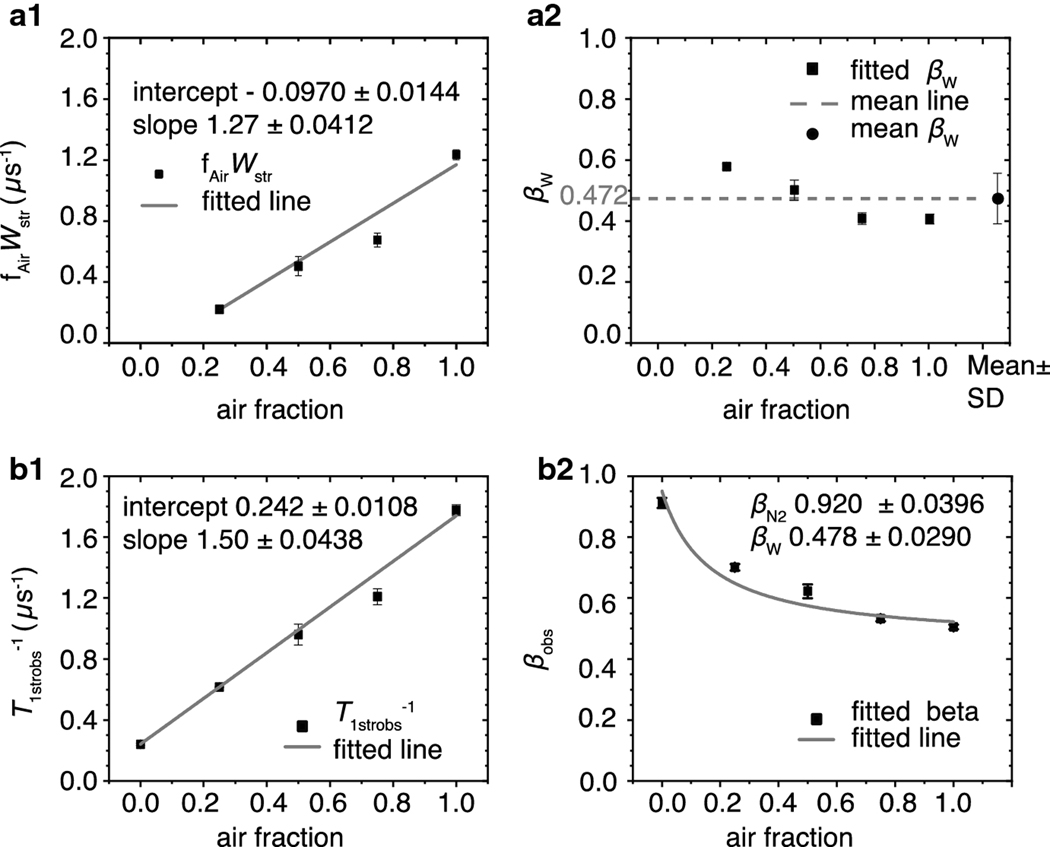
Fig. 6.
The fitting parameters fAirWstr, βW, T1strobs−1, and βobs obtained from air titration of intact nuclear eye lens membranes plotted versus the air fractions at which the signals were obtained. (a1) The black squares are the average fAirWstr values obtained from fitting at least three SR signals using Eq. 8b. The vertical bars represent the corresponding standard deviations. The gray line is the linear fit of these data points with an intercept of −9.70×10⁻² ± 1.44×10⁻² and a slope of 1.27 ± 4.12 ×10⁻² μs−1. The values following the ± sign are standard-error-of-parameter. (a2) The black squares are the average values of βWs obtained from fitting at least three SR signals using Eq. 8b. The vertical bars represent their standard deviations. The black circle represents the average of these values of 0.472, and the vertical bars indicate the standard deviation of 0.0766. The dashed gray line indicates where the measured values fall in relation to the mean. (b1) The average T1strobs−1 values obtained from fitting at least three SR recovery signals using Eq. 9b are indicated by black squares with vertical bars that represent the standard deviations. The gray line is the linear fit of these data points with an intercept 0.242 ± 1.08 × 10⁻² and a slope of 1.50 ± 4.38 × 10⁻² μs−1. The values following the ± sign are standard-error-of-parameter. (b2) The black squares are the average values of βobs obtained from at least three SR signals, and the vertical lines correspond to standard deviations. The fit to Eq. 10 is presented by the gray line. The values of the intercept and slope obtained from the linear fit of the points in (b1) represent T1strN2−1 and Wstr, respectively, and were held constant during fitting. The βN2 and βW parameters were allowed to vary and converged at 0.920 ± 0.0396 and 0.477 ± 0.0290, respectively. The values following the ± signs are the standard-error-of-parameter.

