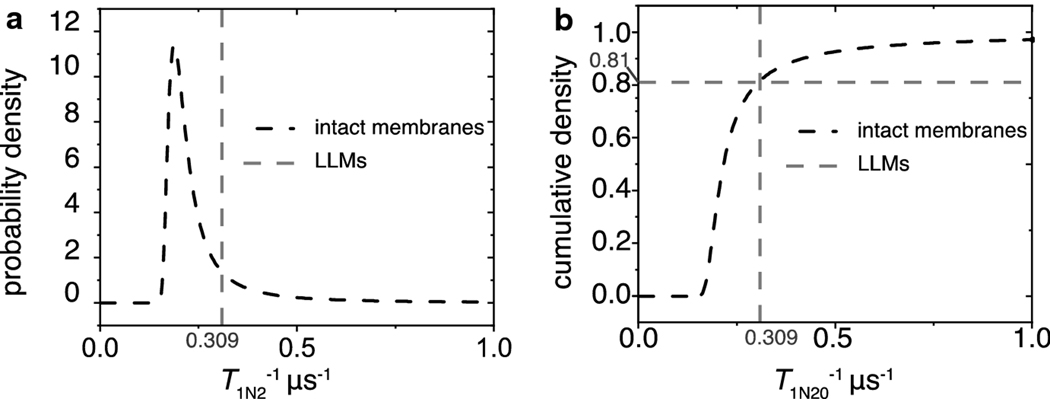
Fig. 7.
The probability distribution densities of rotational diffusion spin-lattice relaxation rates and the integrals (cumulative densities) were constructed as described in the text. (a) The probability distribution density for the spin-lattice relaxation rates associated with the rotational diffusion of ASL in the intact membrane is represented by the dashed black line. The dashed gray line at 0.309 μs−1 represents the rotational diffusion spin-lattice relaxation rate of ASLs in LLMs. (b) The dashed black line is the cumulative density of rotational diffusion spin-lattice relaxation rates for ASL in the intact membranes. The gray dashed line signifies the rotational diffusion spin-lattice relaxation rate of ASLs in LLMs. The crossing point between these lines indicates that 81% of the signal in the intact membranes is from ASLs that relaxed slower than those in the LLMs, and the remainder of the signal relaxed faster.

