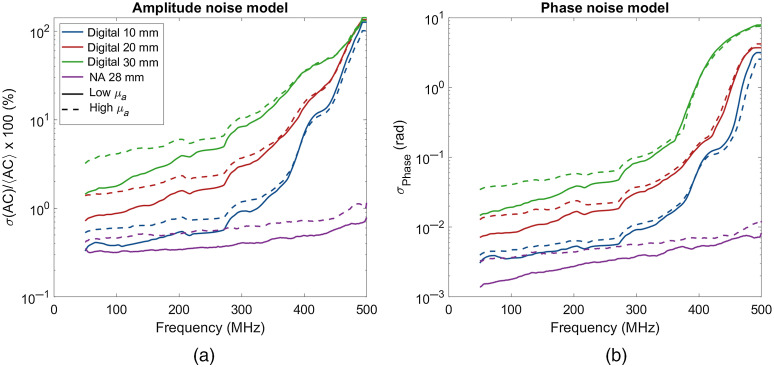
Fig. 4.
(a) Amplitude and (b) phase noise models for the two different instruments investigated presented on a semilogarithmic scale. The digital curves were smoothed with a 5-point moving average filter, and the NA curve was filtered with a 15-point moving average filter. Dashed lines indicate measurements on the high-absorption sample () and solid lines indicate the low-absorption sample ().

