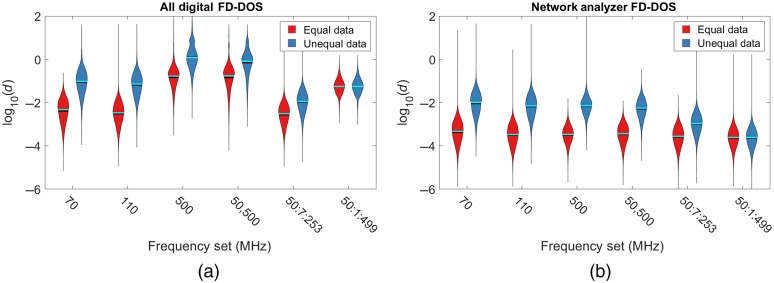
Fig. 5.
Violin plots for the (a) digital FD-DOS system at an SD separation of 30 mm and (b) network analyzer system at an SD separation of 28 mm showing the distribution of OP inversion errors [labeled as defined in Eq. (1)] using equal numbers of data points for each condition (red), or only a single simulated measurement (blue). For the digital system, repeated measurements at 110 MHz and frequencies below 300 MHz resulted in the lowest errors, whereas the network analyzer system was most accurate when all frequencies were used. For single measurements using the digital system, additional frequencies lowered the error so long as high-noise frequencies above 300 MHz were not used. For all plots, the optimized fitting parameters were used.

