FIGURE 1.

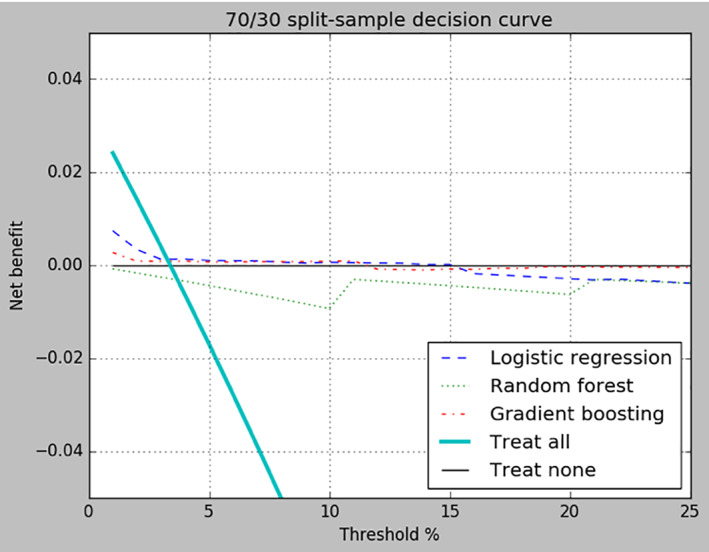
Decision curve for split‐sample. Net benefit of treating all patients, treating none of the patients, and each of the three algorithms are compared across probability threshold values ranging from 1% to 25%

Decision curve for split‐sample. Net benefit of treating all patients, treating none of the patients, and each of the three algorithms are compared across probability threshold values ranging from 1% to 25%