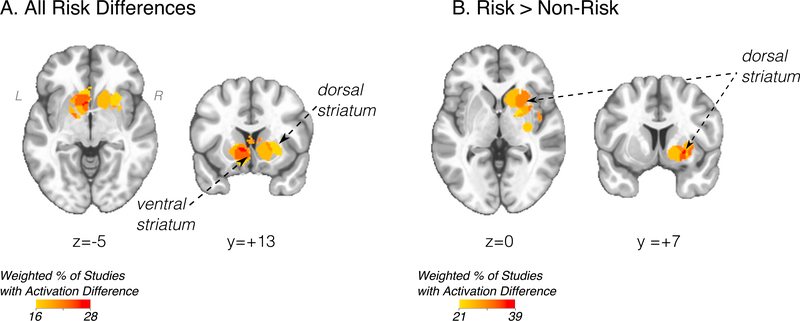
Fig. 1.
A) Primary meta-analysis of all studies and all foci of substance use risk (peak coordinate, LPI MNI -8, 10, 4). B) Increased activation associated with substance use risk (peak coordinate, LPI MNI 26, 8, −4). Statistical maps displayed over Montreal Neurological Institute-152 template in neurological view. All results FWER p < .05 with single voxel p < .01. Scale bar (weighted % of studies with activation difference) refers to the relative proportion of studies with a risk difference, weighted by the square root of the study sample size (see description in Methods section).

