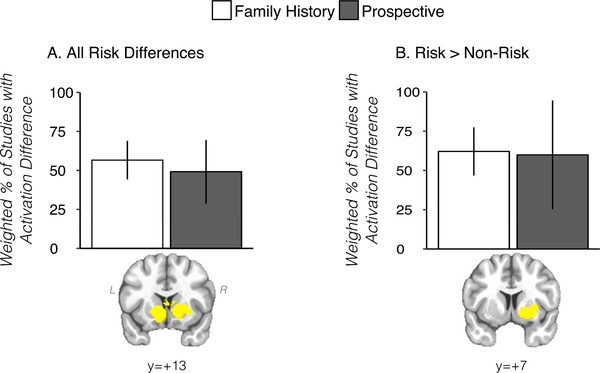
Fig. 2.
Results from prospective prediction and family history of SUD studies in striatal clusters defined from primary meta-analysis (‘all studies’, A) and from ‘risk > non-risk’ studies (B). Y-axes (weighted % of studies with activation difference) refers to the relative proportion of studies with a risk difference, weighted by the square root of the study sample size (see description in Methods section). Cluster displayed in yellow to denote the proportion of studies with activation differences was calculated across the cluster.

