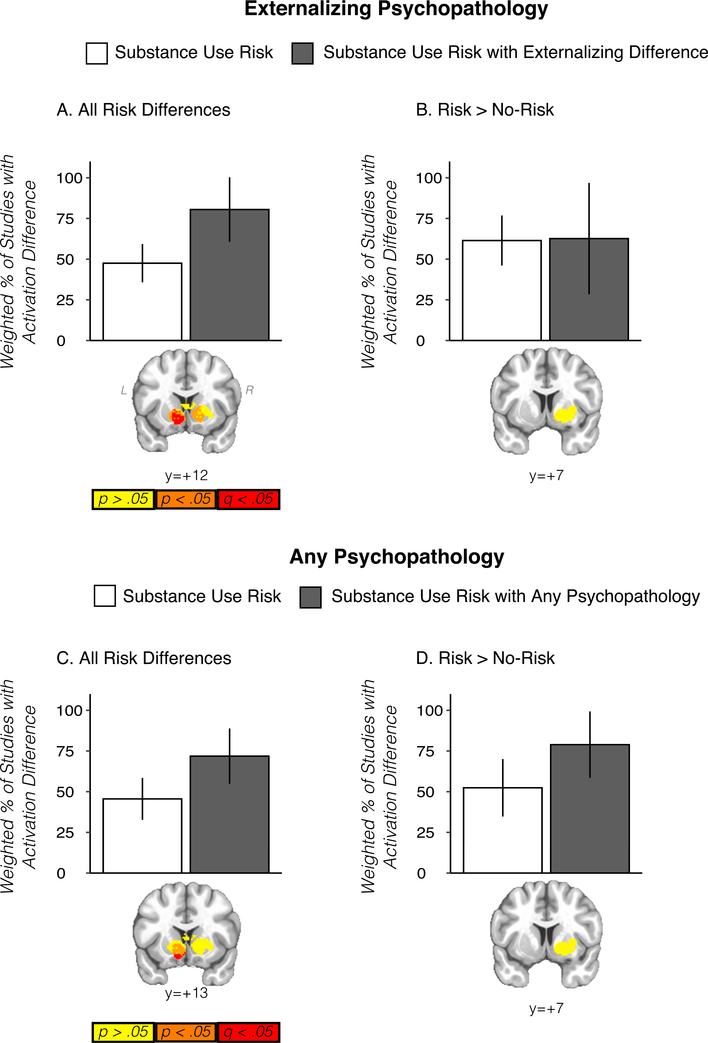
Fig. 3.
Top panel displays results from substance use risk studies with and without externalizing disorders in striatal clusters defined from the primary ’all studies’ meta-analysis (A) and from ’risk > non-risk’ studies (B). Bar plots display proportion of studies with activation differences calculated across the cluster, weighted by the square root of the sample size. Striatal images below show that for the primary meta-analysis (A), studies where substance use risk included externalizing disorders were significantly more likely (FDR-corrected) to report activation differences in the striatum. Scale bar below refers to voxel p-value from chi-square analysis comparing activation difference versus no activation difference in substance use risk and substance use risk with externalizing analysis (yellow, p > .05; orange, p < .05, uncorrected, red, FDR-corrected (q) < 0.05 within striatal mask). C and D display the same information for the analysis where studies including externalizing disorders in substance use risk definitions were aggregated with studies not excluding other psychopathology or where externalizing psychopathology was matched across groups. Statistical maps displayed over Montreal Neurological Institute-152 template in neurological view.

