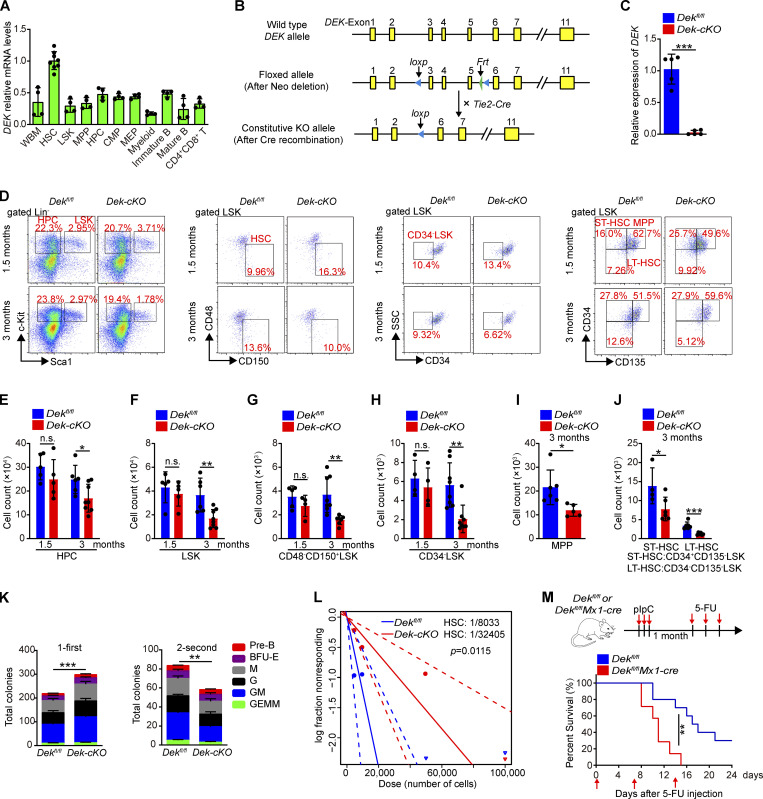
Figure 1.
DEK is highly expressed in HSCs and maintains HSC pool. (A) qRT-PCR analysis of DEK in different hematopoietic cell subsets in WT mice (n = 4–8), including WBM (whole BM cells), HSCs (Lin−c-Kit+Sca-1+CD48−CD150+), LSK cells (Lin−c-Kit+Sca-1+), MPPs (Lin−c-Kit+Sca-1+CD48+CD150−), HPCs (Lin−c-Kit+Sca-1−), CMPs (CD34+CD16/32medHPC), MEPs (CD34−CD16/32−HPC), myeloid cells (Gr1+Mac+), immature B cells (B220+IgM−), mature B cells (B220+IgM+), and CD4+CD8+ T cells. (B) Gene targeting strategies for hematopoietic lineage-specific KO of DEK in mice. (C) Relative mRNA expression of DEK in freshly sorted Dekfl/fl and Dek-cKO HSCs (n = 5). (D) FACS analysis of HPCs, LSK cells, HSCs, MPPs (CD34+CD135+LSK), ST-HSCs (CD34+CD135−LSK), and LT-HSCs (CD34−CD135−LSK) in BM cells of Dekfl/fl and Dek-cKO mice at 1.5 or 3 mo of age. (E–H) Count of HPCs, LSK cells, and HSCs (CD48−CD150+LSK or CD34−LSK) in BM cells of Dekfl/fl and Dek-cKO mice at 1.5 or 3 mo of age (n = 5–8). (I and J) Count of MPPs, ST-HSCs, and LT-HSCs in BM cells of Dekfl/fl and Dek-cKO mice at 3 mo of age (n = 6). (K) In vitro assay of the CFUs of megakaryocyte colonies (GEMM), granulocyte-macrophage colonies (GM), granulocyte colonies (G), macrophage colonies (M), and burst-forming unit-erythroid colonies (BFU-E) at 10–12 d after plating Dekfl/fl and Dek-cKO BM cells (n = 8). For the second plating, live cells from the colonies obtained during the first plating were plated as before and cultured for 10–12 d (n = 4). (L) The CRU frequency is determined by extreme limiting dilution analysis, showing the estimated HSC frequency in the BM of Dekfl/fl and Dek-cKO mice (n = 3 donor mice, five recipients at each cell concentration). (M) Survival curve of Dekfl/fl and Dekfl/flMx1-Cre mice following sequential 5-FU treatment (n = 10). Error bars represent means ± SD. *, P < 0.05; **, P < 0.01; ***, P < 0.001; Student’s t test or Mantel-Cox test. Data are representative of three independent experiments.

