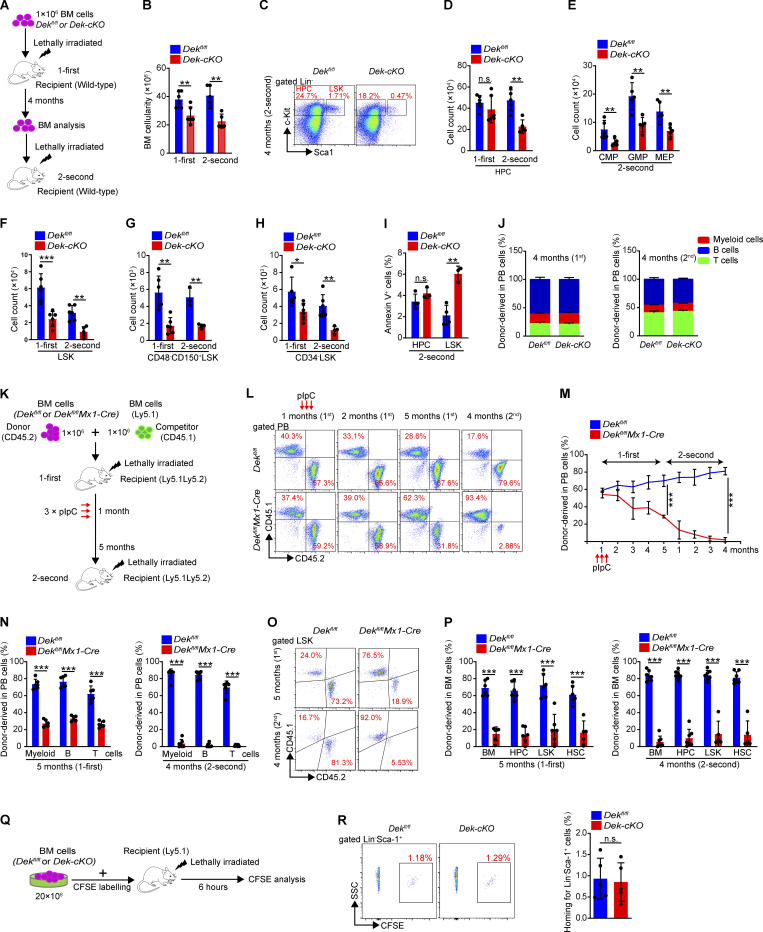
Figure 2.
DEK deficiency impairs HSC self-renewal. (A) Experimental schematic for the serial transplantation assay. (B) BM cell count of recipient mice at 4 mo after first or second transplantation (n = 5–6). (C) FACS analysis of HPCs and LSK cells in BM cells of recipient mice at 4 mo after second transplantation. (D) Count of HPCs in BM cells of recipient mice at 4 mo after first or second transplantation (n = 5–6). (E) Count of CMPs, GMPs, and MEPs in BM cells of recipient mice at 4 mo after second transplantation (n = 5). (F–H) Count of LSK cells and HSCs (CD48−CD150+LSK or CD34−LSK) in BM cells of recipient mice at 4 mo after first or second transplantation (n = 4–6). (I) Analysis of apoptotic HPCs and LSK cells in BM cells of recipient mice at 4 mo after second transplantation. Annexin V+ cells represent early and later apoptotic cells (n = 3–4). (J) The ratio analysis of myeloid cells, B cells, and T cells in PB cells of recipient mice at 4 mo after first and second transplantation (n = 6). (K) Experimental schematic for the competitive transplantation assay. (L) FACS analysis of PB cells from recipient mice in serial competitive transplantation assay (donor-derived CD45.1−CD45.2+ cells, competitor-derived CD45.1+CD45.2− cells). (M) Percentage of donor-derived PB cells at the indicated time points in serial competitive transplantation assay (n = 6–7). (N) Percentage of donor-derived myeloid cells, B cells, and T cells in PB cells of recipient mice at 5 mo after first transplantation (n = 6), or at 4 mo after second transplantation (n = 6–7). (O) FACS analysis of LSK cells from recipient mice BM in serial competitive transplantation assay at 5 mo after first transplantation, or at 4 mo after second transplantation. (P) Percentage of donor-derived BM cells, HPCs, LSK cells, and HSCs at 5 mo after first transplantation (n = 6), or at 4 mo after second transplantation (n = 5–7). (Q) Experimental schematic for the homing assay. (R) FACS analysis of CFSE+ cells in BM Lin−Sca-1+ cells of recipient mice. The histogram indicates in vivo homing percentage of Dekfl/fl and Dek-cKO Lin− Sca-1+ cells in recipient mice at 6 h after transplantation (n = 5). Error bars represent means ± SD. *, P < 0.05; **, P < 0.01; ***, P < 0.001; Student’s t test. Data are representative of three independent experiments.

