Figure 3.
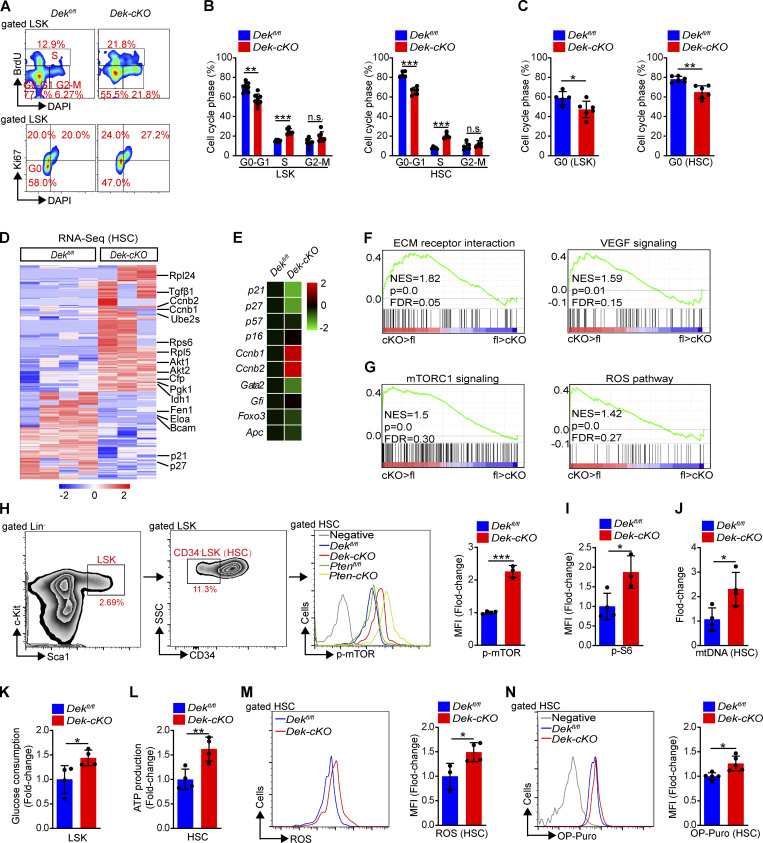
DEK loss decreases quiescence and activates mTOR signaling in HSCs. (A) FACS analysis of BrdU incorporation and Ki-67 staining in LSK cells of Dekfl/fl and Dek-cKO mice at 3 mo of age. (B) Cell-cycle analysis of LSK cells and HSCs in Dekfl/fl and Dek-cKO mice at 3 mo of age (n = 4–8). (C) Quiescence (G0 phase) analysis of LSK cells and HSCs in Dekfl/fl and Dek-cKO mice at 3 mo of age (n = 5–6). (D) Representative heatmap of upregulated genes or downregulated genes by 1.5-fold or more in Dek-cKO HSCs compared with Dekfl/fl HSCs (n = 3–4; P < 0.01). (E) qRT-PCR analysis of the indicated genes from freshly sorted HSCs (n = 4). (F and G) GSEA of the selected gene sets. (H and I) FACS analysis of p-mTOR and p-S6 in HSCs of the indicated mice. The histograms indicate the mean fluorescence intensity (MFI) analysis of p-mTOR and p-S6 (n = 3–4). (J) Quantitative PCR analysis of mitochondrial DNA (mtDNA) in freshly sorted HSCs (n = 4). (K) Glucose consumption analysis of LSK cells. Sorted LSK cells were in vitro for 24 h, and the change in glucose concentration in the culture medium was measured (n = 4). (L) ATP level in freshly sorted HSCs (n = 4). (M) FACS analysis of ROS level in HSCs. The histogram indicates the MFI analysis of ROS in HSCs (n = 3–4). (N) FACS analysis of OP-Puro incorporation in HSCs. The histogram indicates the MFI analysis of OP-Puro in HSCs (n = 5). *, P < 0.05; **, P < 0.01; ***, P < 0.001; Student’s t test. Data in A–C, E, and H–N are representative of three independent experiments. NES, normalized enrichment score; FDR, false discovery rate; ECM, extracellular matrix; VEGF, vascular endothelial growth factor.

