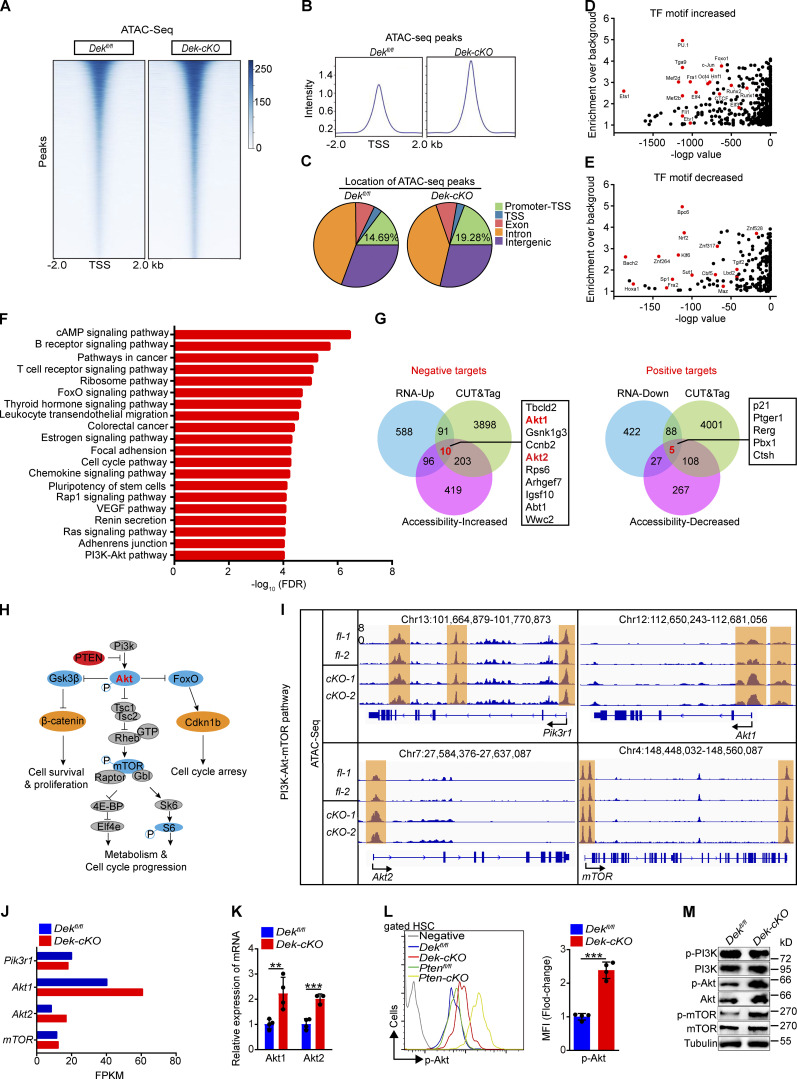
Figure 4.
Akt1 and Akt2 are direct targets of DEK in HSCs by altering the chromatin accessibility landscape. (A) Representative heatmap of genome-wide ATAC-seq signal around genes in HSCs freshly sorted from Dekfl/fl and Dek-cKO mice (n = 3 biological independent samples per group). (B) Average diagram of genome-wide chromatin accessibility at TSS regions (±2,000 bp). (C) Location of all ATAC-seq peaks in Dekfl/fl and Dek-cKO HSCs. Promoter-TSS, the region between promoter and TSS (−1 kb to 100 bp). (D) Enrichment of the increased known TF binding motifs in different chromatin-accessible regions. (E) Enrichment of the decreased known TF binding motifs in different chromatin-accessible regions. (F) Pathway analysis of the genes with significant changed ATAC peaks (over twofold change; P < 0.01) in DEK-deficient HSCs. (G) Integrative analysis to identify transcriptome-wide potential targets of DEK in HSCs. Left: Potential negative targets of DEK. Right: Potential positive targets of DEK. RNA-Up and RNA-Down indicate genes with significantly increased and decreased expression, respectively, upon DEK deletion in HSCs as detected by RNA-seq (FPKM > 1, fold change > 1.5). CUT&Tag indicates genes with significant enrichment in DEK binding (reads per kilobase per million > 1). Accessibility-Increased and Accessibility-Decreased indicates genes with significantly increased and decreased accessibility, respectively, upon DEK deletion in HSCs as detected by ATAC-seq (reads per kilobase per million > 1, fold change > 2). (H) Summary of the PI3K-Akt-mTOR pathway. (I) Accessible chromatin located at gene loci, including Pi3kr1, Akt1, Akt2, and mTOR. (J) The FPKM value of indicated genes. Data are from RNA-seq. (K) Relative mRNA expression of Akt1 and Akt2 in freshly sorted Dekfl/fl and Dek-cKO HSCs (n = 4). (L) FACS analysis of p-Akt in HSCs of the indicated mice. The histograms indicate the mean fluorescence intensity analysis (n = 4). (M) Western blot of PI3K-Akt-mTOR pathway proteins in lysates prepared from freshly sorted Lin−c-Kit+ cells. **, P < 0.01; ***, P < 0.001; Student’s t test. Data in K–M are representative of three independent experiments. VEGF, vascular endothelial growth factor.

